od Command Examples (Octal Dump)


1. Display contents of file in octal format using -b option

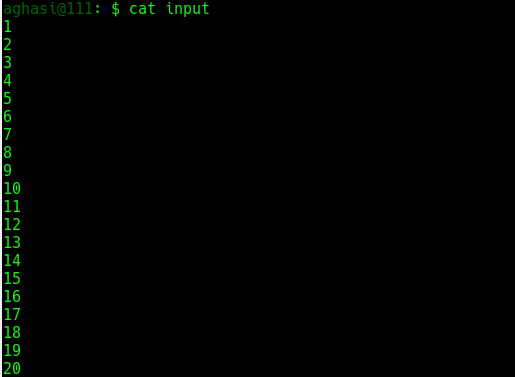
The following is the input file used for this example:

$ cat input

Now execute od command on this input file:

$ od -b input

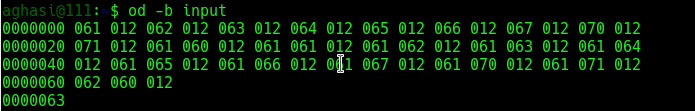
So we see that output was produced in octal format. The first column in the output of od represents the byte offset in file.


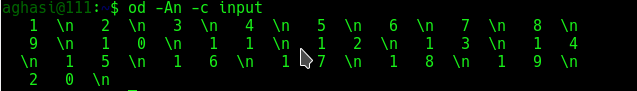
2. Display contents of file in character format using -c option

Using the same input file:
$ od -c input

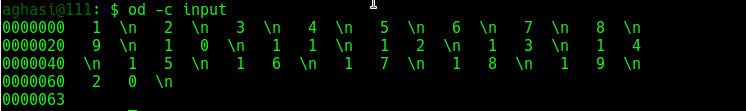
So we see that the output was produced in the character format.


3. Display the byte offsets in different formats using -A option

The byte offset can be displayed in any of the following formats :

  • Hexadecimal (using -x along with -A)
  • Octal (using -o along with -A)
  • Decimal (using -d along with -A)

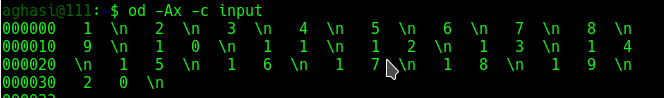
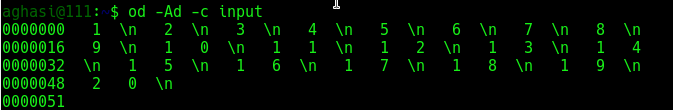
The following are the examples of offsets in different formats :

$ od -Ax -c input

$ od -Ad -c input

$ od -Ao -c input

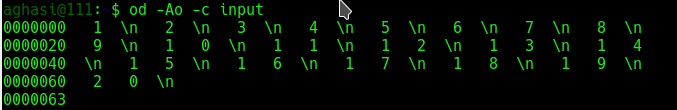
So we see that as per the input supplied to the -A option, the first column (that contains the byte offset) is displayed in different formats.


4. Display no offset information using -An option

Consider the following example:
$ od -An -c input

So we see that byte offset related information was not displayed.


5. Display output after skipping some bytes

This is achieved by using -j option:
$ od -j9 -c input

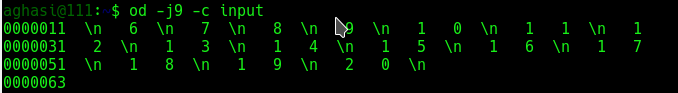
If we compare the above output with the output in example 2, we can see that initial 9 bytes were skipped from output.


6. Display limited bytes in output using -N option

This is the opposite of the -j option discussed in example 5 above:

$ od -N9 -c input

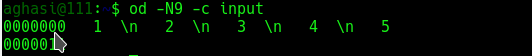
So we see that only 9 bytes were displayed in the output.


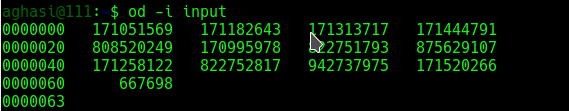
7. Display output as decimal integers using -i option

Consider the following example:
$ od -i input

If we combine -i with -b then its gives more information as to how decimal integers are displayed:

$ od -ib input

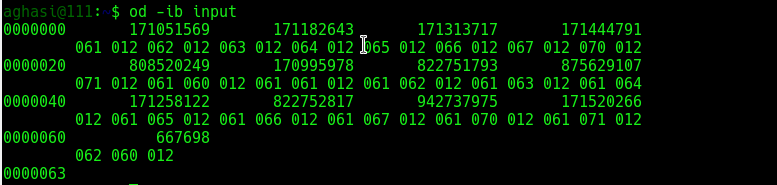
So the above output shows how octal output is displayed as integer output.


8. Display output as hexadecimal 2 byte units using -x option

Consider the following example:
$ od -x input

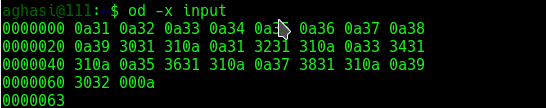
So we see that the output was displayed in terms of hexadecimal 2 byte units.


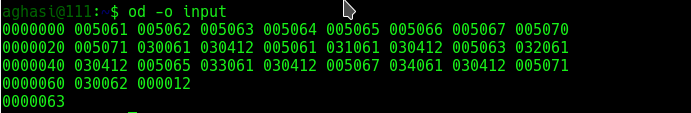
9. Display the contents as two byte octal units using -o option

Consider the following example:
$ od -o input

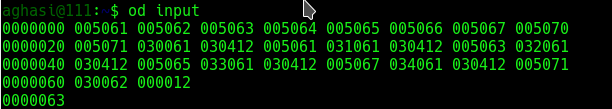
Note that the od command displays the same output when run without any option:
$ od  input


10. Customize the output width using -d option

Consider the following example:
$ od -w1 -c -Ad input

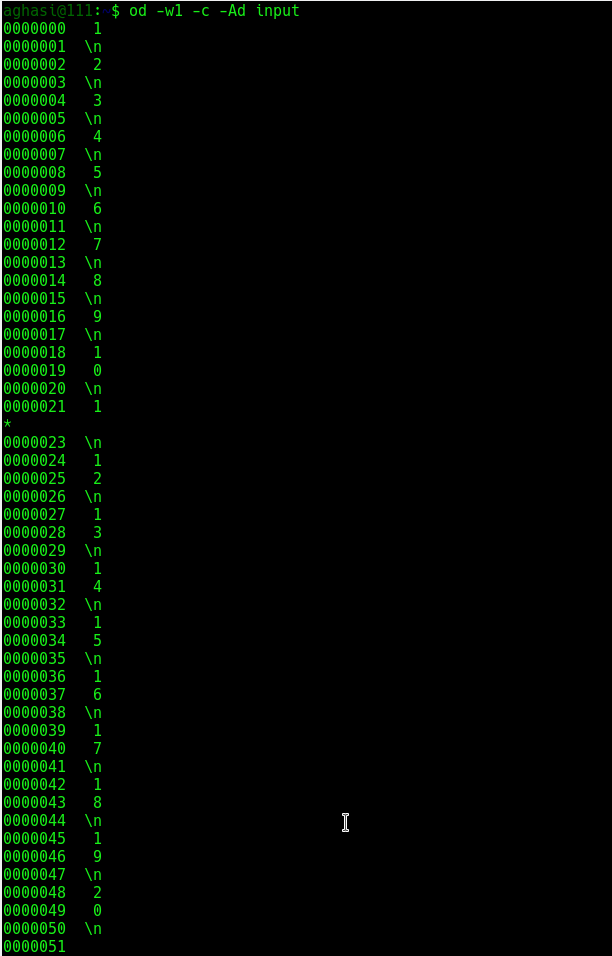
So we see that output width was reduced to 1 in the above output.


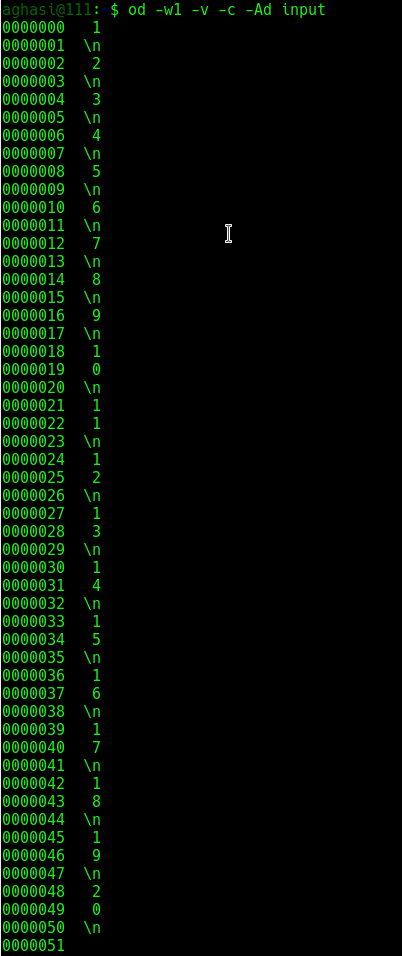
11. Output duplicates using -v option

As can be observed in the output of example 10 above, a * was printed. This is done to suppress the output of lines that are same or duplicates. But through -v option these lines can also be printed:
$ od -w1 -v -c -Ad input


12. Accept input from command line using -

Consider the following example:
$ od -c -

So we see that first the input was given through stdin and then after pressing the ctrl+d a couple of times the od command output was displayed.


13. Use od on a text file

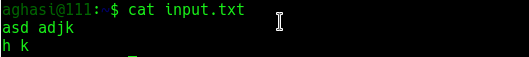
The following sample text file is used in the examples below:
$ cat input.txt

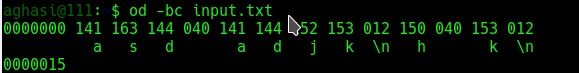
Option -b and -c are typical usages as shown below:

  • -b is same as option -t oC, select octal bytes
  • -c is same as option -t c, select ASCII characters or backslash escapes

$ od -c input.txt


$ od -bc input.txt


14. Use od on a binary file

Read the first 16 bytes and display equivalent ASCII characters or backslash:
$ od -N16 -c /usr/bin/h2xs

Read the first 16 bytes and display equivalent names characters:
$ od -N16 -a /usr/bin/h2xs

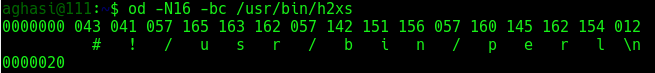
Read the first 16 bytes and display octal bytes:
$ od -N16 -bc /usr/bin/h2xs
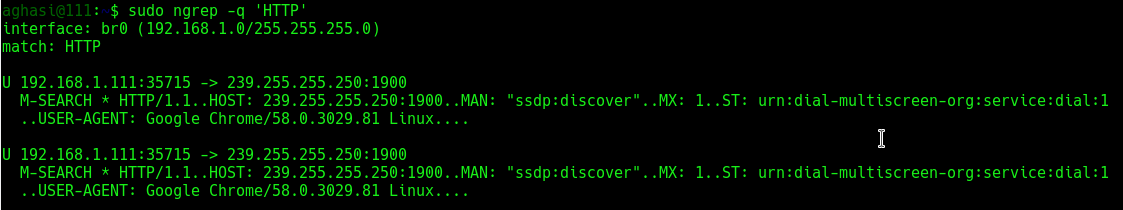
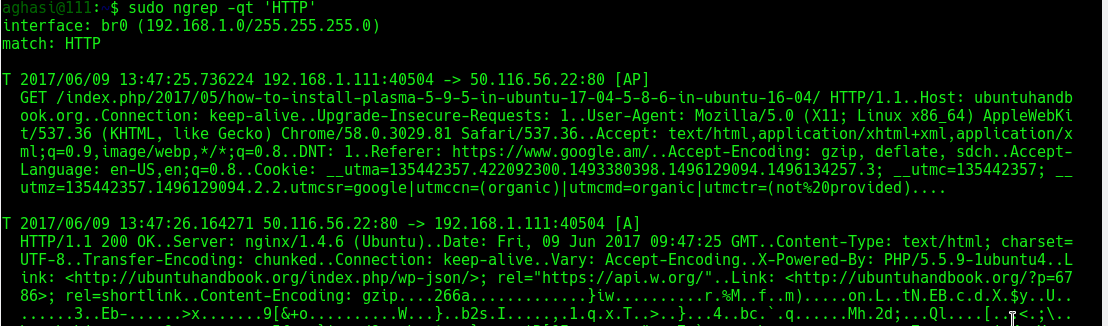
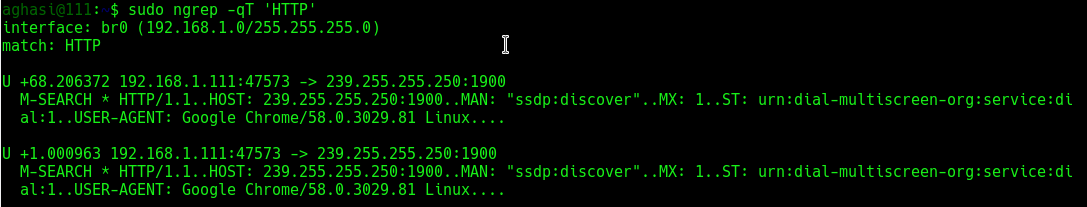
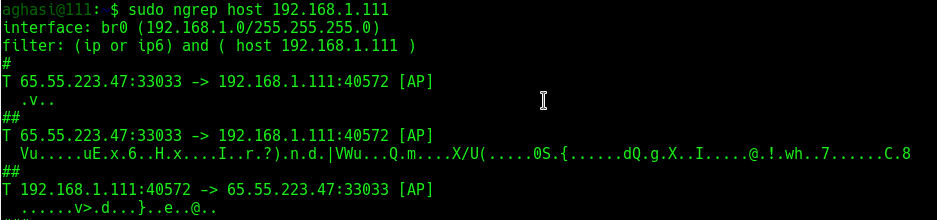
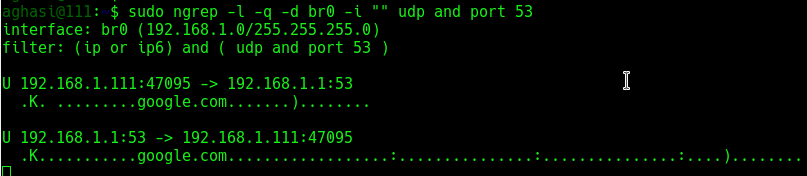
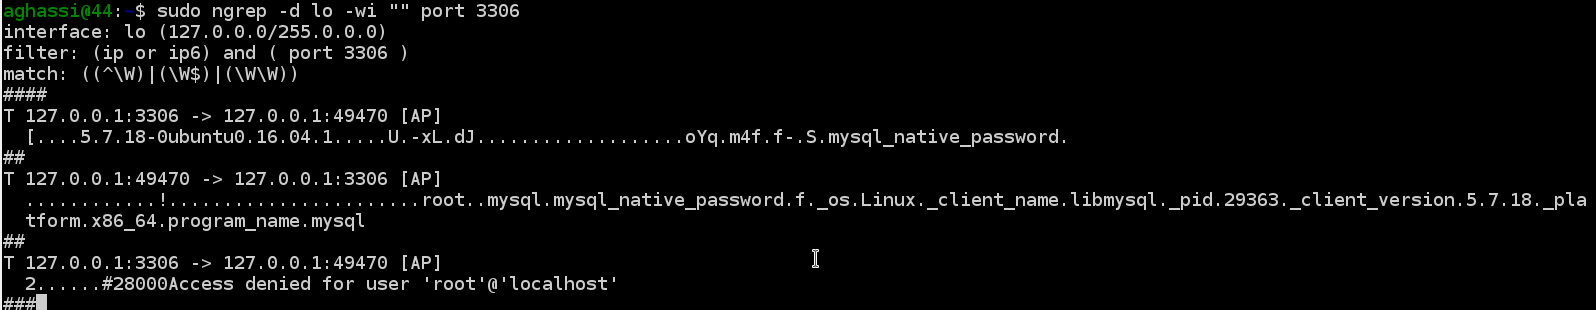


How To Use ngrep Magical Toolkit


Introduction

ngrep strives to provide most of GNU grep‘s common features, applying them to the network layer. ngrep is a pcap-aware tool that will allow you to specify extended regular or hexadecimal expressions to match against data payloads of packets. It currently recognizes IPv4/6, TCP, UDP, ICMPv4/6, IGMP and Raw across Ethernet, PPP, SLIP, FDDI, Token Ring and null interfaces, and understands BPF (Berkeley Packet Filter)  logic in the same fashion as more common packet sniffing tools, such as tcpdump and snoop. You can print live networking packets to stdout, redirect (>) the contents to a file, or pipe (|) to another utility.


Installation

ngrep is intended to be used alongside your standard *nix command-line tooling. Thus, most package repositories are sufficiently up-to-date.

On Ubuntu use apt-get:

$ sudo apt-get install ngrep

On CentOS, use yum:

$ sudo yum install ngrep

In the following examples, it is assumed that br0 is the used network interface (unless otherwise stated).


Packet Sniffing

Monitor all interfaces and protocols for a string match of “HTTP“. The -q flag will quiet the output by printing only packet headers and relevant payloads:

$ sudo ngrep -q 'HTTP'

Use the -t flag to print a timestamp along with the matched information. Use -T to print the time elapsed between successive matches:

$ sudo ngrep -qt 'HTTP'

Monitor all activity crossing source or destination port 25 (SMTP):

$ sudo ngrep -d any port 25

Monitor any network-based syslog traffic for the occurrence of the word “error“. ngrep knows how to convert service port names (on Linux, located in /etc/services) to port numbers:

$ sudo ngrep -d any 'error' port syslog

Monitor any traffic crossing source or destination port 21 (FTP), looking case-insensitively for the words user or pass, matched as word-expressions (the match term(s) must have non-alphanumeric, delimiting characters surrounding them):

$ sudo ngrep -wi -d any 'user|pass' port 21

Monitor all traffic not going over port 22 (SSH):

$ sudo ngrep not port 22 | strings -n 8

Monitor all traffic coming from a certain host:

$ sudo ngrep host 192.168.1.111

Capture network traffic incoming/outgoing to/from br0 interface and show the DNS (UDP/53) querys and responses:

$ sudo ngrep -l -q -d br0 -i "" udp and port 53

ngrep‘s syntax is similar to that of tcpdump:

$ sudo ngrep port 80 and src host 192.168.1.111 and dst host 192.168.1.1

Now let’s look for people misusing bandwidth:

$ sudo ngrep -i 'game*|chat|recipe' -W byline > bad_user.txt

To monitor current email transactions and print the addresses:

$ sudo ngrep -i 'rcpt to|mail from' tcp port smtp


Common BPF filters

The BPF specifies a rich syntax for filtering network packets based on information such as IP address. Matches all headers containing the string “HTTP” sent to or from the IP address starting with “192.168“:

$ sudo ngrep -q 'HTTP' 'host 192.168'

Will do as above, but instead match a destination host:

$ sudo ngrep -q 'HTTP' 'dst host 192.168'

Will do as above, but instead match a source host:

$ sudo ngrep -q 'HTTP' 'src host 192.168'

IP protocol:

$ sudo ngrep -q 'HTTP' 'tcp'
$ sudo ngrep -q 'HTTP' 'udp'
$ sudo ngrep -q 'HTTP' 'icmp'

Port number:

$ sudo ngrep -q 'HTTP' 'port 80'


Debugging HTTP interactions

In certain scenarios it is desirous to see how web browsers communicate with web servers, and to inspect the “HTTP” headers and possibly cookie values that they are exchanging:

$ sudo ngrep port 80

To see which files your browser is requesting any packet on the network which consists of “GET” followed by any characters but ending in “HTTP/1.0” or “HTTP/1.1“:

$ sudo ngrep -q '^GET .* HTTP/1.[01]'

Match only requests going to port 80:

$ sudo ngrep -q '^GET .* HTTP/1.[01]' 'port 80'

Match only requests going to the destination “1it.click“:

$ sudo ngrep -q '^GET .* HTTP/1.[01]' 'host 1it.click'

You can use regex such as ‘.*‘ in the search string:

$ sudo ngrep -d any "domain-.*.com" port 80

-W byline mode tells ngrep to respect embedded line feeds when they occur. You’ll note from the output above that there is still a trailing dot (.) on each line, which is the carriage-return portion of the CRLF { Carriage Return (ASCII 13, \r) Line Feed (ASCII 10, \n) } pair:

$ sudo ngrep -W byline port 80

Capture network traffic incoming/outgoing to/from br0 interface and show parameters following HTTP (TCP/80)GET or POST” methods

$ sudo ngrep -l -q -d br0 -i "^GET |^POST " tcp and port 80

Capture network traffic incoming/outgoing to/from br0 interface and show the HTTP (TCP/80)User-Agent: ” string

$ sudo ngrep -l -q -d br0 -i "User-Agent: " tcp and port 80

In the above command :
a) tcp and port 80 – is the BPF filter, that sniffs only TCP packet with port number 80
b) The -d option specifies the interface to sniff  ( br0 in this case)
c) "User-Agent: " is the string to search for all packets that have that string are displayed

Monitor specific traffic:

$ sudo ngrep -t '^(GET|POST|HEAD) ' 'dst host 216.58.210.14 and tcp and dst port 80'

Then send a header request to a specific URL:

$ curl -I google.com

Or, break the response by newlines:

$ sudo ngrep -t '^(GET|POST|HEAD) ' 'dst host 216.58.210.14 and tcp and dst port 80' -W byline


Processing PCAP dump files, looking for patterns

Timestamp all traffic on port 53 (DNS) on all devices (if the box has multiple devices) and send the output to a pcap file specified by the -O switch:

$ sudo ngrep -O /tmp/dns.dump -d any -T port domain

Now we have a PCAP dump file, and so let’s search for the letter ‘m‘ for some patterns:

$ sudo ngrep -w 'm' -I /tmp/dns.dump

Here we’ve added -t which means print the absolute timestamp on the packet, and -D which means replay the packets by the time interval at which they were recorded. The latter is a neat little feature for observing the traffic at the rates/times they originally seen, though in this example it’s not terribly effective as there is only one packet being matched.

$ sudo ngrep -tD ns3 -I /tmp/dns.dump
$ sudo ngrep -I /tmp/dns.dump port 80

There’s no port 80 traffic in the dump, so of course the BPF filter yields us no results.


Debugging MySQL

Show the query and results of SELECT queries going to your MySQL server:

$ sudo ngrep -d br0 -i 'select' port 3306

Show the query and results of all queries going to your MySQL server:

If the following MySQL query returns the following:

$ sudo mysql -h 127.0.0.1 -B -e 'select * from user;' mysql

Watch the traffic:

# sudo ngrep -d lo -wi "" port 3306