How To Use netstat


Introduction

netstat (network statistics) is a command line tool for monitoring network connections both incoming and outgoing as well as viewing routing tables, interface statistics etc. netstat is available on all Unix-like Operating Systems and also available on Windows OS as well. It is very useful in terms of network troubleshooting and performance measurement. netstat is one of the most basic network service debugging tools, telling you what ports are open and whether any programs are listening on ports.


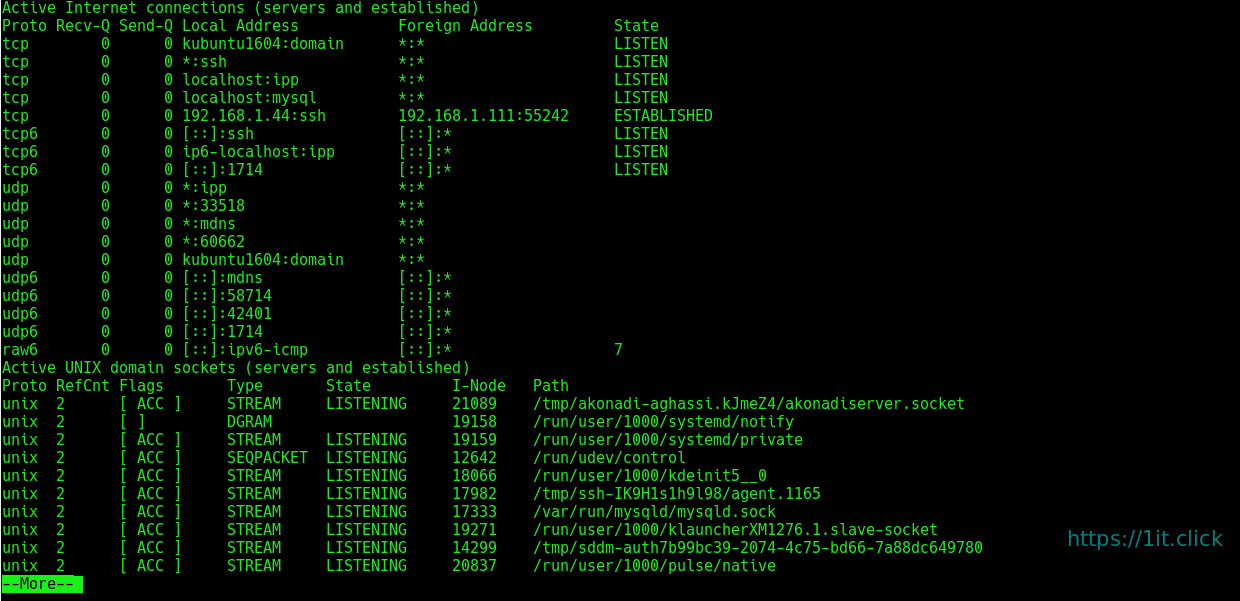
Listing all the LISTENING Ports of TCP and UDP connections

$ netstat -a | more


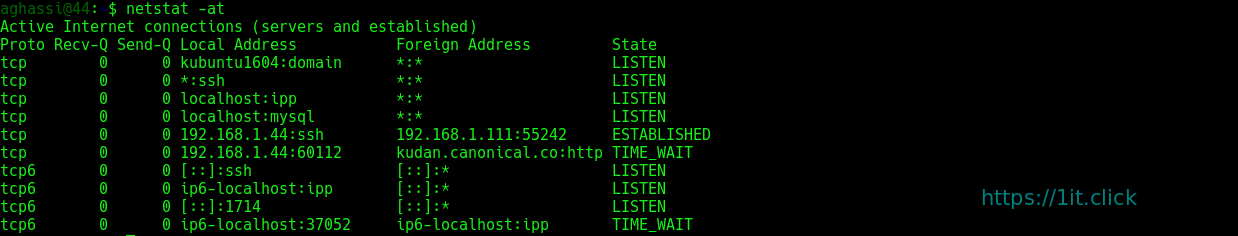
Listing TCP Ports connections

Listing only TCP (Transmission Control Protocol) port connections:

$ netstat -at


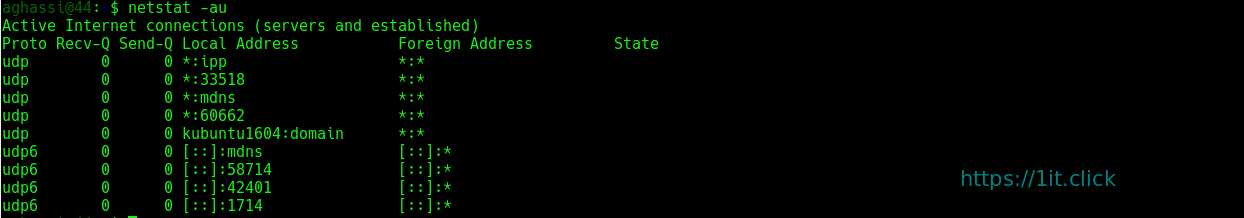
Listing UDP Ports connections

Listing only UDPUser Datagram Protocol ) port connections:

$ netstat -au


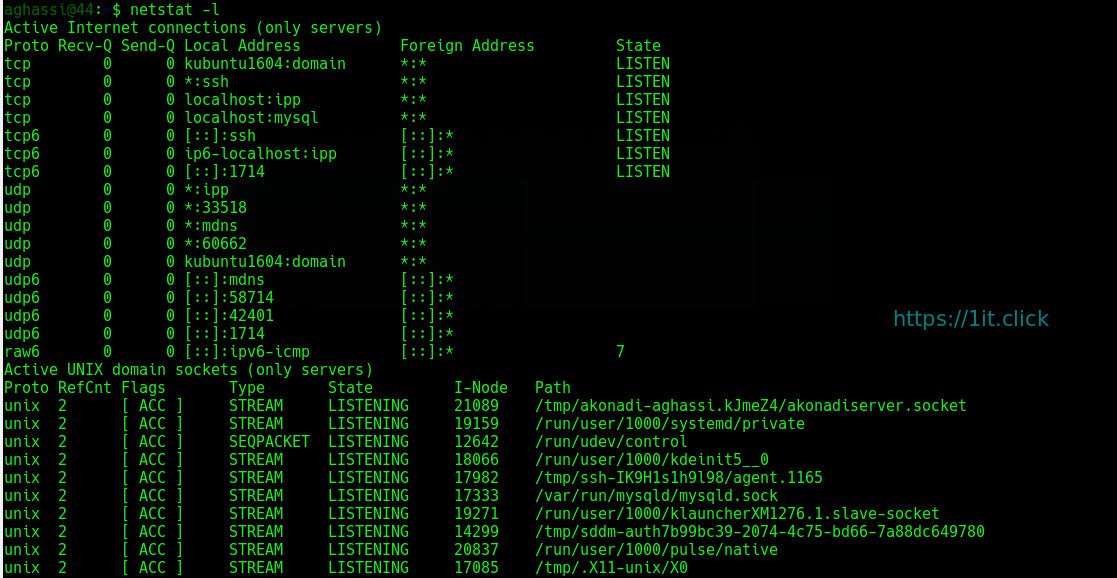
Listing All LISTENING Connections

Listing all active listening ports connections:

$ netstat -l

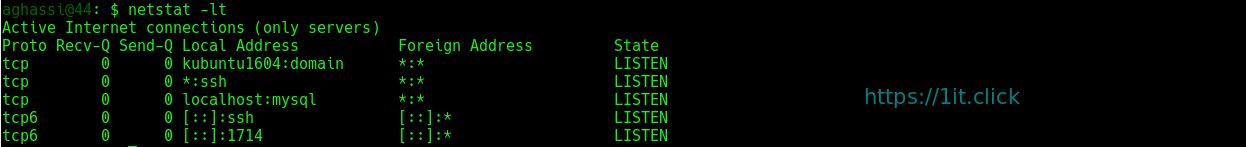
Listing All TCP Listening Ports

Listing all active listening TCP ports:

$ netstat -lt


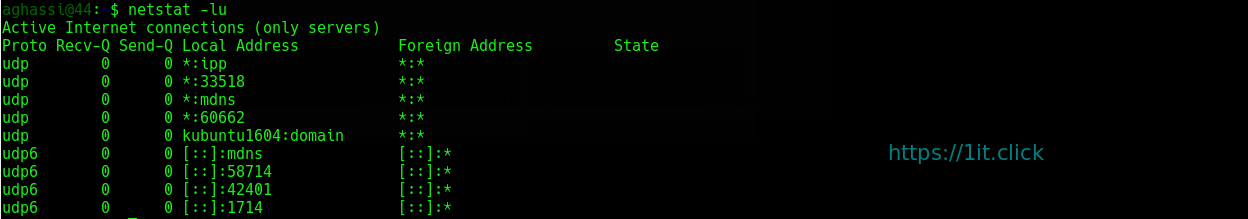
Listing All UDP Listening Ports

Listing all active listening UDP ports:

$ netstat -lu


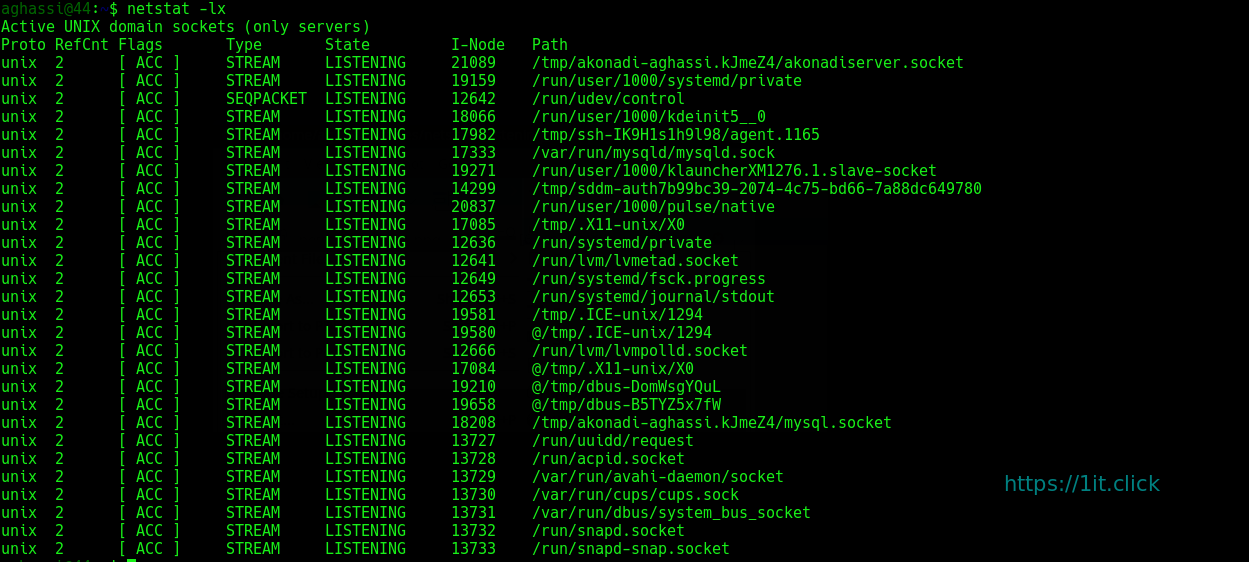
Listing all UNIX Listening Ports

Listing all active UNIX listening ports:

$ netstat -lx


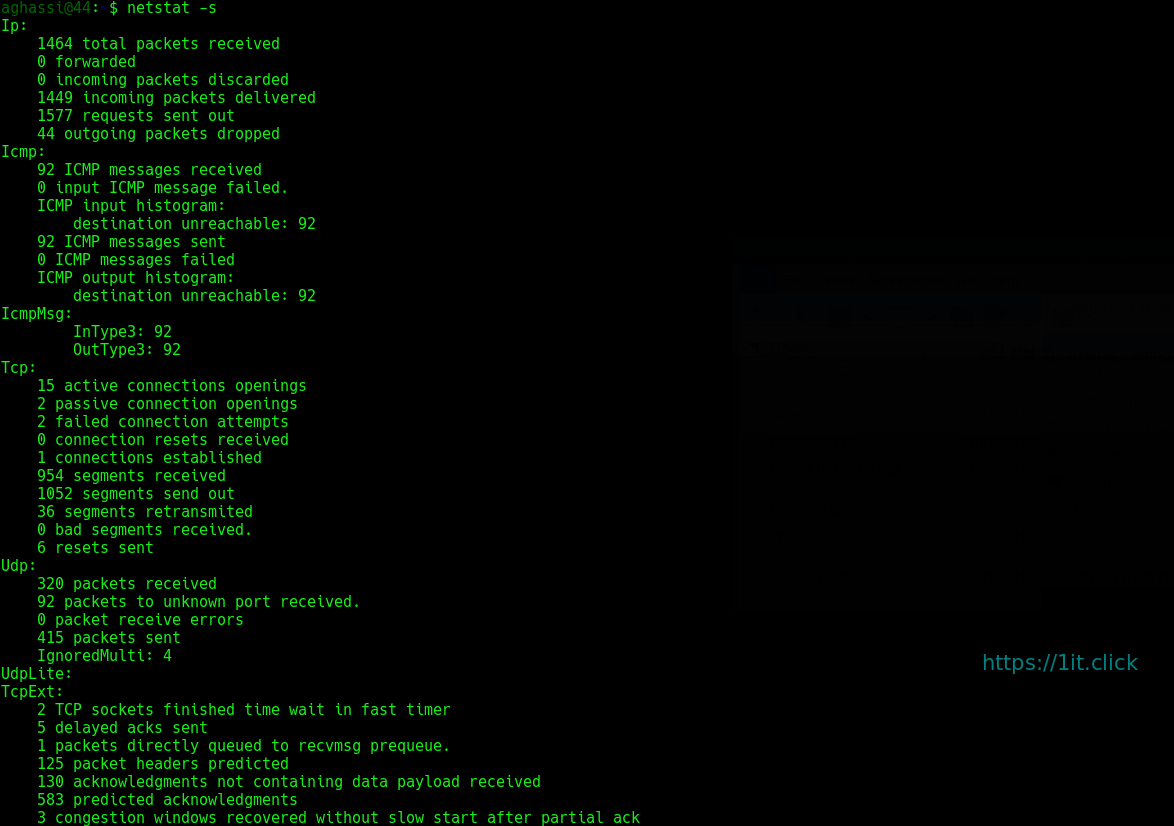
Showing Statistics by Protocol

Displays statistics by protocol. By default, statistics are shown for the TCP, UDP, ICMP, and IP protocols. The -s parameter can be used to specify a set of protocols:

$ netstat -s


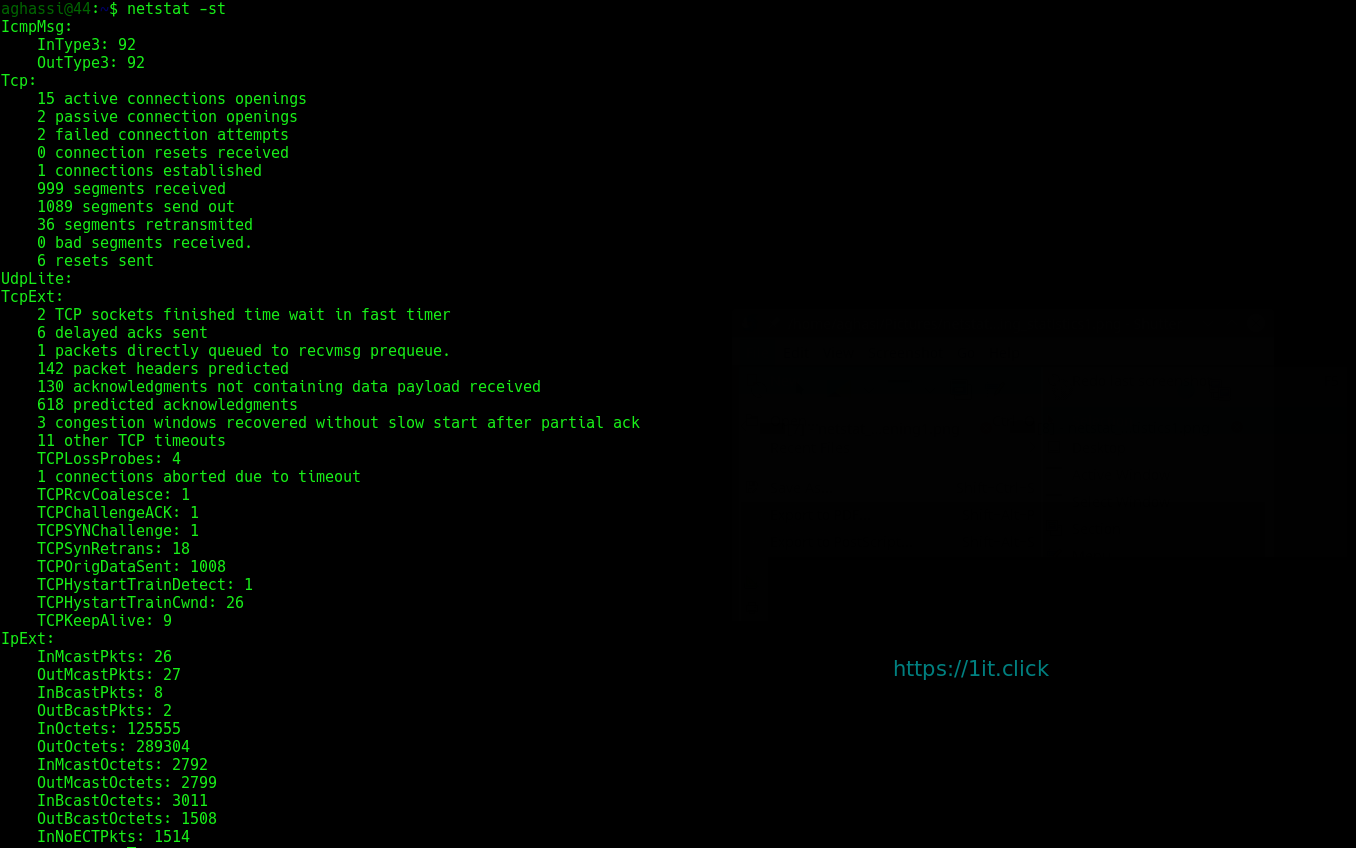
Showing Statistics by TCP Protocol

Showing statistics of only TCP protocol:

$ netstat -st


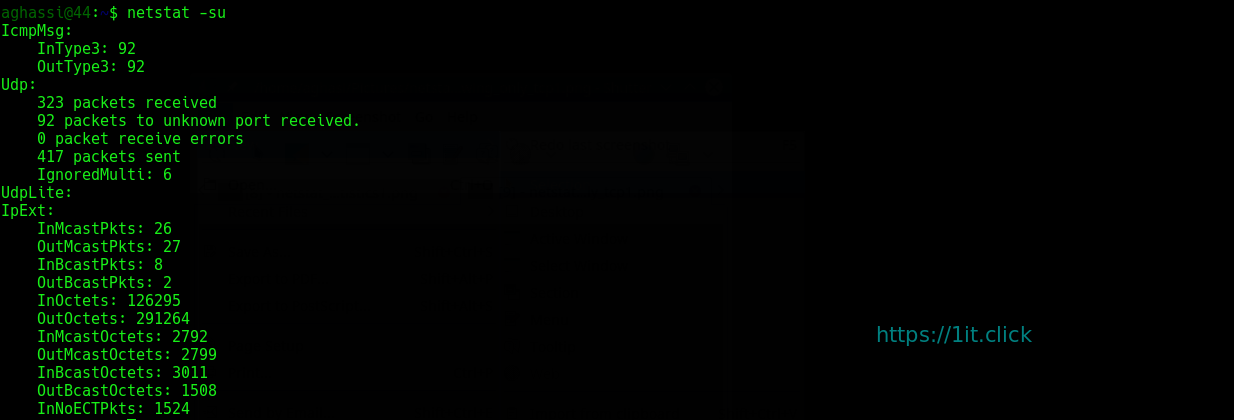
Showing Statistics by UDP Protocol

Showing statistics of only UDP protocol:

$ netstat -su


Displaying Service name with PID

Displaying service name with their “PID/Program Name”:

$ netstat -tp


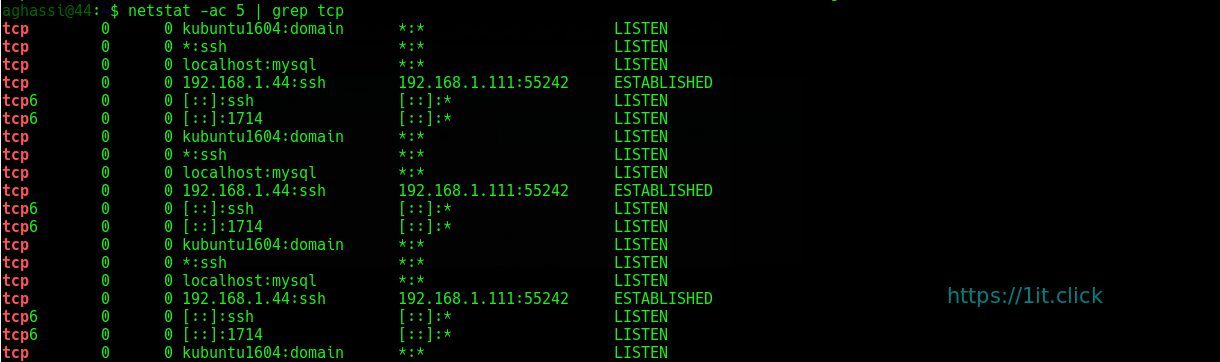
Displaying Promiscuous Mode

Displaying Promiscuous mode with -ac switch, netstat print the selected information or refresh screen every five second. Default screen refresh in every second.

$ netstat -ac 5 | grep tcp


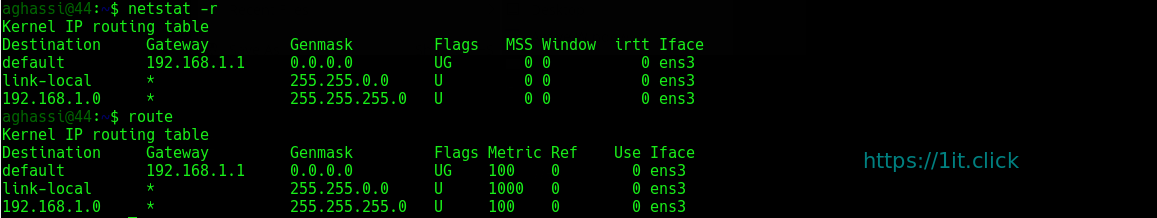
Displaying Kernel IP routing

Display Kernel IP routing table with netstat and route command:

$ netstat -r


Showing Network Interface Transactions

Showing network interface packet transactions including both transferring and receiving packets with MTU size:

$ netstat -i


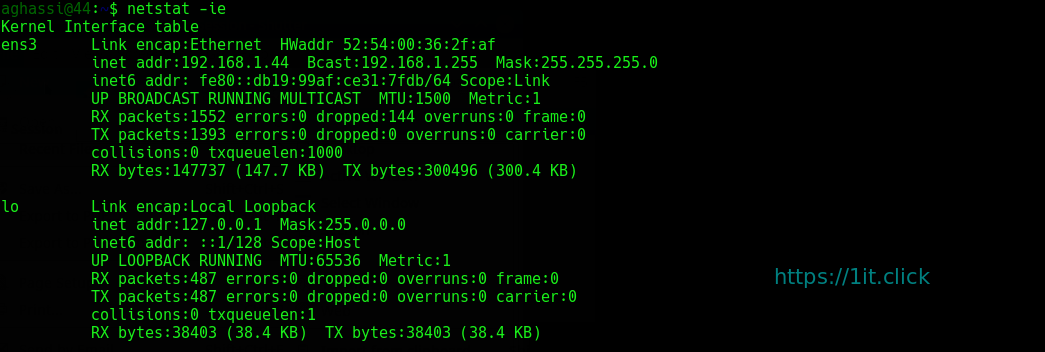
Showing Kernel Interface Table

Showing Kernel interface table, similar to ifconfig command:

$ netstat -ie


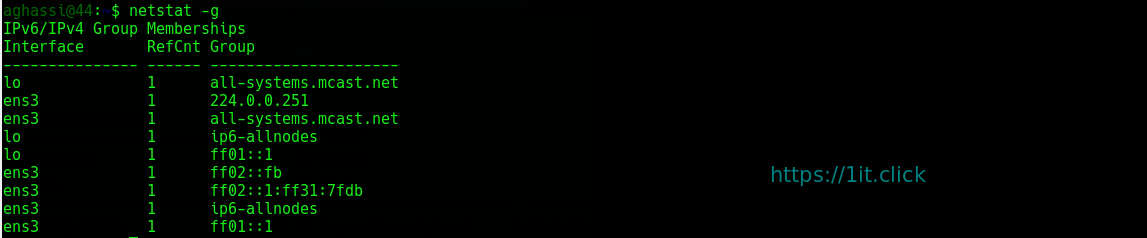
Displaying IPv4 and IPv6 Information

Displays multicast group membership information for both IPv4 and IPv6:

$ netstat -g


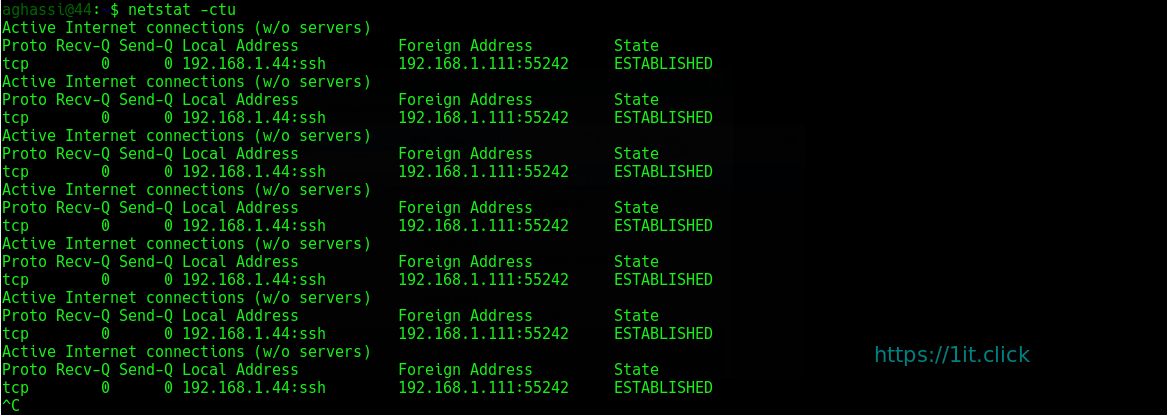
Print netstat Information Continuously

To get netstat information every few second, then use the following command, it will print netstat information continuously, say every few seconds

$ netstat -c


Finding Non Supportive Address

Finding un-configured address families with some useful information:

$ netstat --verbose


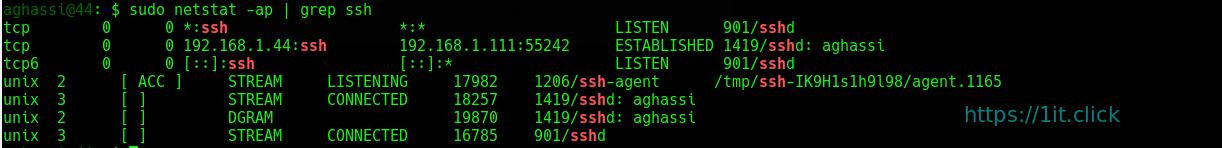
Finding Listening Programs

Find out how many listening programs running on a port:

$ sudo netstat -ap | grep ssh


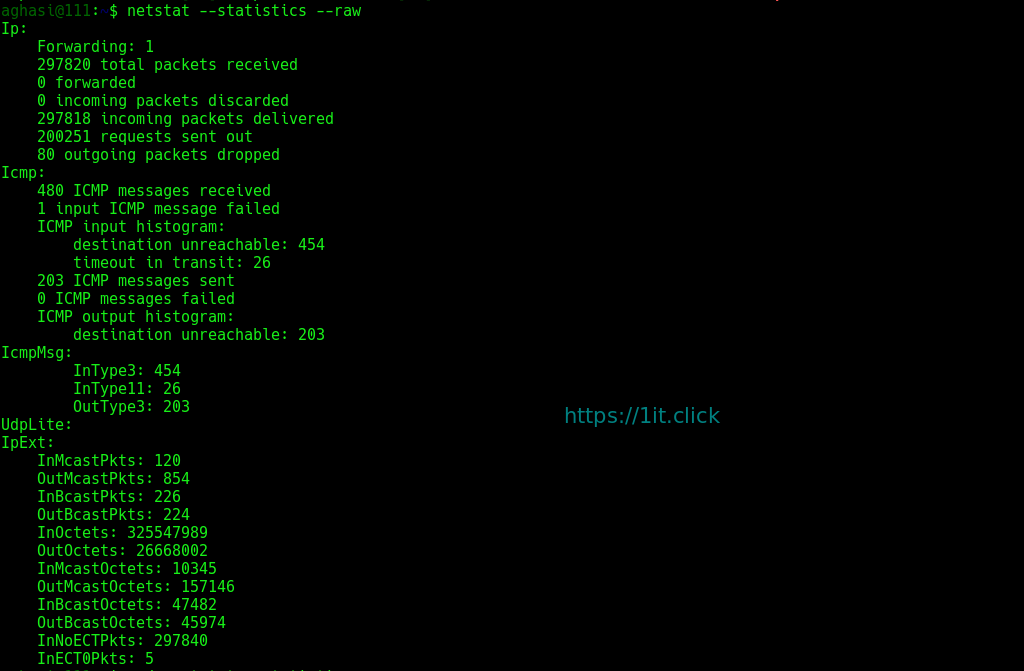
Displaying RAW Network Statistics

$ netstat --statistics --raw

How To Use smartctl


Introduction

The step by step command example below show the process of using SMART disk monitoring tool that provide us with the information of overall hard disk health status. The SMART it self stand for Self Monitoring Analysis and Reporting Tool and on Linux, the smartctl command is use to display and manipulate SMART. The step by step example below show how to use smartctl command to enable SMART and disable SMART on the hard disk drives and the example below also show the use the smartctl command to get hard disk drive health status.


Installation

On Ubuntu use apt:

$ sudo apt install smartmontools

On CentOS, use yum:

$ sudo  yum install smartmontools


Enabling SMART Monitoring Tools on Hard Disk Devices (turn on SMART)

To enable SMART on hard disk drive, the example below show that the SMART is enable (turn to ON status) on the /dev/sdc :

$ sudo smartctl -s on /dev/sdc

Verify the SMART status turn to Enable (on) for the disk device:

$ sudo smartctl -i /dev/sdc

Test if your disk has SMART support:

$ sudo smartctl -i -d ata /dev/sdc

Note: The command example below show another example of smartctl command that can be use to enable SMART monitoring tool on the disk device:

$ sudo smartctl --smart=on --offlineauto=on --saveauto=on /dev/sdc


Disable SMART Monitoring Tools on Hard Disk Devices (turn off SMART)

To disable the SMART monitoring tool for the disk device:

$ sudo smartctl -s off /dev/sdc

To verify the changes made:

$ sudo smartctl -i /dev/sdc


Get Hard Disk Device SMART Health Status

The smart command example below show the information on the hard disk device health status for /dev/sdc device. {if you get FAILED, you should start backing up your data and browsing adds for a new hard drive. }

$ sudo  smartctl -H /dev/sdc


To run short test on your hard disk

$ sudo smartctl -t short /dev/sdc


To see the selftest logs of smartctl

$ sudo smartctl -l selftest /dev/sdc


To check past problems of your drive

$ sudo smartctl -l error /dev/sdc

$ sudo smartctl -d ata --all /dev/sdc

$ sudo smartctl -a /dev/sdc | grep -i reallocated

The 323 > 0 means that everything is NOT OK, then you should think about the replacement.

$ sudo smartctl -q errorsonly -H -l selftest -l error /dev/sdc


Logging With Journald In CentOS7


Introduction

CentOS 7 comes with services which saves logging information. Some services write their own logs directly to their log information files, e.g. apache maintain their own logs. Some of the service maintain their logs through systemctl. Systemctl is a services that take care of starting, stopping or monitoring the status of a process. systemctl further communicates to journald which keep track on log information. journalctl is used to grep log information from journald.

rsyslog is the classical logging method. You may ask either we should use journalctl or rsyslog to maintain our logging information. We can integrate both rsyslog ans journald. The rsyslog messages will be sent to journald or vice versa. The facility is not enabled by default.


Definition of Journal

Journal is a component of systemd. It capture log messages of kernel logs, syslog messages, or error log messages. It collect them, index them and makes available to the users. Journal are stored in /run/log/journal directory.


Lets have a look on current log database:

When used alone, every journal entry that is in the system will be displayed within a pager (usually less) for you to browse. The oldest entries will be up top:

$ sudo journalctl

You will likely have pages and pages of data to scroll through, which can be tens or hundreds of thousands of lines long if systemd has been on your system for a long while. But, there are some remarkable difference, in journalctl lines having notices or waning will be bold, time-stamps are your local time zone, after every boot a new line will be added to clarify that new log begins from now, errors will be highlighted red.


See log message of current boot only

$ sudo journalctl -b


Let us see some error messages

$ sudo journalctl -p err

To have last 10 events that happen, type

$ sudo journalctl -f


See how must disk space is occupied by journal

$ sudo journalctl --disk-usage
Archived and active journals take up 16.0M in the file system.


To get data of previous day

$ sudo journalctl --since yesterday

To get current system time zone

$ timedatectl  
     Local time: Fri 2017-06-16 17:06:35 +04
 Universal time: Fri 2017-06-16 13:06:35 UTC
       RTC time: Fri 2017-06-16 13:06:35
      Time zone: Asia/Dubai (+04, +0400)
Network time on: yes
NTP synchronized: yes
RTC in local TZ: no


List system time zone

$ timedatectl list-timezones


Set system time zone

$ sudo timedatectl set-timezone Asia/Dubai


Integration of Journald with Rsyslog

With the integration the rsyslog messages will be sent to journald or vice versa. The facility is not enabled by default.  To enable sending log messages to journal  rsyslog.conf is required to configure.

Edit /etc/rsyslog.conf

search for $ModLoad imuxsock and and $ModLoad imjournal

add $OmitLocalLoggin off in a new line

[root@localhost ~]# vim /etc/rsyslog.conf

Sample output

#rsyslog configuration file
# For more information see /usr/share/doc/rsyslog-*/rsyslog_conf.html
# If you experience problems, see http://www.rsyslog.com/doc/troubleshoot.html
#### MODULES ####
# The imjournal module bellow is now used as a message source instead of imuxsock.
$ModLoad imuxsock # provides support for local system logging (e.g. via logger command)
$OmitLocalLoggin off
$ModLoad imjournal # provides access to the systemd journal
#$ModLoad imklog # reads kernel messages (the same are read from journald)
#$ModLoad immark # provides –MARK– message capability
# Provides UDP syslog reception
#$ModLoad imudp
#$UDPServerRun 514
# Provides TCP syslog reception
#$ModLoad imtcp
#$InputTCPServerRun 514
#### GLOBAL DIRECTIVES ####

Save the file and exit.

Open /etc/rsyslog.d/listen.conf

[root@localhost ~]# vim /etc/rsyslog.d/listen.conf

Make sure following line is already present in the file, if not so then add this line to the file.

$SystemLogSocketName /run/systemd/journal/syslog

Save and exit.

Now, This will make connection b/w rsyslog and journald.

Logical Volume Manager (LVM)


Introduction

With LVM, we can create logical partitions that can span across one or more physical hard drives. First, the hard drives are divided into physical volumes, then those physical volumes are combined together to create the volume group and finally the logical volumes are created from volume group.Before we start, install the lvm2 package.

On CentOS use yum:

$ sudo yum install lvm2

On Ubuntu use apt:

$ sudo apt install lvm2

To create a LVM, we need to run through the following steps:

  1. Select the physical storage devices for LVM
  2. Create the Volume Group from Physical Volume
  3. Create Logical Volumes from Volume Group

Creating LVM Volumes

To begin, use the fdisk command to create physical partitions for the storage device on which you want to create logical partitions. Here we have an 500GB drive, located on device /dev/sdc:


Before proceeding, make sure you have made the correct changes to the correct partition! If everything looks correct, write the new partition table, as follows:

The kernel still uses the old table. The new table will be used at the next reboot or after you run partprobe(8) or kpartx(8).

Back at the shell prompt, use the sfdisk command to see the partitioning on the drive:


or

Next, make /dev/sdc1 a new LVM physical volume and use the pvs command to view information about physical LVM volumes:

Then use vgcreate to create the vg1 volume group and list the active current volume groups:

Use lvcreate to create a new LVM partition of 1 GB from the vg1 volume group. Then use lvs to see the logical volume and vgs to see that the amount of free space has changed:

To create an ext4 filesystem on the lvm partition, use the mkfs.ext4 command as follows:

The ext4 filesystem has now been created and the LVM volume is ready to use.


Using LVM Volumes

To use the new volume just created, represented by /dev/mapper/vg1-lvm_u1, create a mount point /mnt/u1  and mount the volume. Then use df to check the available space:

At this point, the file system contains only the lost+found directory:

Copy a file to the new file system. For example, choose one of the kernel files from the /boot directory and copy it to /mnt/u1:

Run md5sum on the file you copied and save the resulting checksum for later:


Growing the LVM Volume

Say that you are running out of space and you want to add more space to your LVM volume. To do that, unmount the volume and use the lvresize command. ( Actually, it is not required that you unmount the volume to grow it, but it is done here as an extra precaution. )  After that, you must also check the file system with e2fsck and run resize2fs to resize the ext4 filesystem on that volume:

In the example just shown, the volume and the file system are both resized to 3 GB. Next, mount the volume again and check the disk space and the md5sum you created earlier:

The newly mounted volume is now 3 GB instead of 1 GB in size.


Shrinking an LVM Volume

You can also use the lvresize command if you want to take unneeded space from an existing LVM volume. As before, unmount the volume before resizing it and run e2fsck (to check the file system) and resize2fs (to resize it to the smaller size):

The newly mounted volume appears now as 1984 MB instead of 2992 MB in size.


Removing LVM Logical Volumes and Groups

To remove an LVM logical volume from a volume group, unmount it and then use the lvremove command as follows:

To remove an existing LVM volume group, use the vgremove command: