How To Use netstat


Introduction

netstat (network statistics) is a command line tool for monitoring network connections both incoming and outgoing as well as viewing routing tables, interface statistics etc. netstat is available on all Unix-like Operating Systems and also available on Windows OS as well. It is very useful in terms of network troubleshooting and performance measurement. netstat is one of the most basic network service debugging tools, telling you what ports are open and whether any programs are listening on ports.


Listing all the LISTENING Ports of TCP and UDP connections

$ netstat -a | more


Listing TCP Ports connections

Listing only TCP (Transmission Control Protocol) port connections:

$ netstat -at


Listing UDP Ports connections

Listing only UDPUser Datagram Protocol ) port connections:

$ netstat -au


Listing All LISTENING Connections

Listing all active listening ports connections:

$ netstat -l

Listing All TCP Listening Ports

Listing all active listening TCP ports:

$ netstat -lt


Listing All UDP Listening Ports

Listing all active listening UDP ports:

$ netstat -lu


Listing all UNIX Listening Ports

Listing all active UNIX listening ports:

$ netstat -lx


Showing Statistics by Protocol

Displays statistics by protocol. By default, statistics are shown for the TCP, UDP, ICMP, and IP protocols. The -s parameter can be used to specify a set of protocols:

$ netstat -s


Showing Statistics by TCP Protocol

Showing statistics of only TCP protocol:

$ netstat -st


Showing Statistics by UDP Protocol

Showing statistics of only UDP protocol:

$ netstat -su


Displaying Service name with PID

Displaying service name with their “PID/Program Name”:

$ netstat -tp


Displaying Promiscuous Mode

Displaying Promiscuous mode with -ac switch, netstat print the selected information or refresh screen every five second. Default screen refresh in every second.

$ netstat -ac 5 | grep tcp


Displaying Kernel IP routing

Display Kernel IP routing table with netstat and route command:

$ netstat -r


Showing Network Interface Transactions

Showing network interface packet transactions including both transferring and receiving packets with MTU size:

$ netstat -i


Showing Kernel Interface Table

Showing Kernel interface table, similar to ifconfig command:

$ netstat -ie


Displaying IPv4 and IPv6 Information

Displays multicast group membership information for both IPv4 and IPv6:

$ netstat -g


Print netstat Information Continuously

To get netstat information every few second, then use the following command, it will print netstat information continuously, say every few seconds

$ netstat -c


Finding Non Supportive Address

Finding un-configured address families with some useful information:

$ netstat --verbose


Finding Listening Programs

Find out how many listening programs running on a port:

$ sudo netstat -ap | grep ssh


Displaying RAW Network Statistics

$ netstat --statistics --raw

How To Use smartctl


Introduction

The step by step command example below show the process of using SMART disk monitoring tool that provide us with the information of overall hard disk health status. The SMART it self stand for Self Monitoring Analysis and Reporting Tool and on Linux, the smartctl command is use to display and manipulate SMART. The step by step example below show how to use smartctl command to enable SMART and disable SMART on the hard disk drives and the example below also show the use the smartctl command to get hard disk drive health status.


Installation

On Ubuntu use apt:

$ sudo apt install smartmontools

On CentOS, use yum:

$ sudo  yum install smartmontools


Enabling SMART Monitoring Tools on Hard Disk Devices (turn on SMART)

To enable SMART on hard disk drive, the example below show that the SMART is enable (turn to ON status) on the /dev/sdc :

$ sudo smartctl -s on /dev/sdc

Verify the SMART status turn to Enable (on) for the disk device:

$ sudo smartctl -i /dev/sdc

Test if your disk has SMART support:

$ sudo smartctl -i -d ata /dev/sdc

Note: The command example below show another example of smartctl command that can be use to enable SMART monitoring tool on the disk device:

$ sudo smartctl --smart=on --offlineauto=on --saveauto=on /dev/sdc


Disable SMART Monitoring Tools on Hard Disk Devices (turn off SMART)

To disable the SMART monitoring tool for the disk device:

$ sudo smartctl -s off /dev/sdc

To verify the changes made:

$ sudo smartctl -i /dev/sdc


Get Hard Disk Device SMART Health Status

The smart command example below show the information on the hard disk device health status for /dev/sdc device. {if you get FAILED, you should start backing up your data and browsing adds for a new hard drive. }

$ sudo  smartctl -H /dev/sdc


To run short test on your hard disk

$ sudo smartctl -t short /dev/sdc


To see the selftest logs of smartctl

$ sudo smartctl -l selftest /dev/sdc


To check past problems of your drive

$ sudo smartctl -l error /dev/sdc

$ sudo smartctl -d ata --all /dev/sdc

$ sudo smartctl -a /dev/sdc | grep -i reallocated

The 323 > 0 means that everything is NOT OK, then you should think about the replacement.

$ sudo smartctl -q errorsonly -H -l selftest -l error /dev/sdc


Logging With Journald In CentOS7


Introduction

CentOS 7 comes with services which saves logging information. Some services write their own logs directly to their log information files, e.g. apache maintain their own logs. Some of the service maintain their logs through systemctl. Systemctl is a services that take care of starting, stopping or monitoring the status of a process. systemctl further communicates to journald which keep track on log information. journalctl is used to grep log information from journald.

rsyslog is the classical logging method. You may ask either we should use journalctl or rsyslog to maintain our logging information. We can integrate both rsyslog ans journald. The rsyslog messages will be sent to journald or vice versa. The facility is not enabled by default.


Definition of Journal

Journal is a component of systemd. It capture log messages of kernel logs, syslog messages, or error log messages. It collect them, index them and makes available to the users. Journal are stored in /run/log/journal directory.


Lets have a look on current log database:

When used alone, every journal entry that is in the system will be displayed within a pager (usually less) for you to browse. The oldest entries will be up top:

$ sudo journalctl

You will likely have pages and pages of data to scroll through, which can be tens or hundreds of thousands of lines long if systemd has been on your system for a long while. But, there are some remarkable difference, in journalctl lines having notices or waning will be bold, time-stamps are your local time zone, after every boot a new line will be added to clarify that new log begins from now, errors will be highlighted red.


See log message of current boot only

$ sudo journalctl -b


Let us see some error messages

$ sudo journalctl -p err

To have last 10 events that happen, type

$ sudo journalctl -f


See how must disk space is occupied by journal

$ sudo journalctl --disk-usage
Archived and active journals take up 16.0M in the file system.


To get data of previous day

$ sudo journalctl --since yesterday

To get current system time zone

$ timedatectl  
     Local time: Fri 2017-06-16 17:06:35 +04
 Universal time: Fri 2017-06-16 13:06:35 UTC
       RTC time: Fri 2017-06-16 13:06:35
      Time zone: Asia/Dubai (+04, +0400)
Network time on: yes
NTP synchronized: yes
RTC in local TZ: no


List system time zone

$ timedatectl list-timezones


Set system time zone

$ sudo timedatectl set-timezone Asia/Dubai


Integration of Journald with Rsyslog

With the integration the rsyslog messages will be sent to journald or vice versa. The facility is not enabled by default.  To enable sending log messages to journal  rsyslog.conf is required to configure.

Edit /etc/rsyslog.conf

search for $ModLoad imuxsock and and $ModLoad imjournal

add $OmitLocalLoggin off in a new line

[root@localhost ~]# vim /etc/rsyslog.conf

Sample output

#rsyslog configuration file
# For more information see /usr/share/doc/rsyslog-*/rsyslog_conf.html
# If you experience problems, see http://www.rsyslog.com/doc/troubleshoot.html
#### MODULES ####
# The imjournal module bellow is now used as a message source instead of imuxsock.
$ModLoad imuxsock # provides support for local system logging (e.g. via logger command)
$OmitLocalLoggin off
$ModLoad imjournal # provides access to the systemd journal
#$ModLoad imklog # reads kernel messages (the same are read from journald)
#$ModLoad immark # provides –MARK– message capability
# Provides UDP syslog reception
#$ModLoad imudp
#$UDPServerRun 514
# Provides TCP syslog reception
#$ModLoad imtcp
#$InputTCPServerRun 514
#### GLOBAL DIRECTIVES ####

Save the file and exit.

Open /etc/rsyslog.d/listen.conf

[root@localhost ~]# vim /etc/rsyslog.d/listen.conf

Make sure following line is already present in the file, if not so then add this line to the file.

$SystemLogSocketName /run/systemd/journal/syslog

Save and exit.

Now, This will make connection b/w rsyslog and journald.

How To Use ngrep Magical Toolkit


Introduction

ngrep strives to provide most of GNU grep‘s common features, applying them to the network layer. ngrep is a pcap-aware tool that will allow you to specify extended regular or hexadecimal expressions to match against data payloads of packets. It currently recognizes IPv4/6, TCP, UDP, ICMPv4/6, IGMP and Raw across Ethernet, PPP, SLIP, FDDI, Token Ring and null interfaces, and understands BPF (Berkeley Packet Filter)  logic in the same fashion as more common packet sniffing tools, such as tcpdump and snoop. You can print live networking packets to stdout, redirect (>) the contents to a file, or pipe (|) to another utility.


Installation

ngrep is intended to be used alongside your standard *nix command-line tooling. Thus, most package repositories are sufficiently up-to-date.

On Ubuntu use apt-get:

$ sudo apt-get install ngrep

On CentOS, use yum:

$ sudo yum install ngrep

In the following examples, it is assumed that br0 is the used network interface (unless otherwise stated).


Packet Sniffing

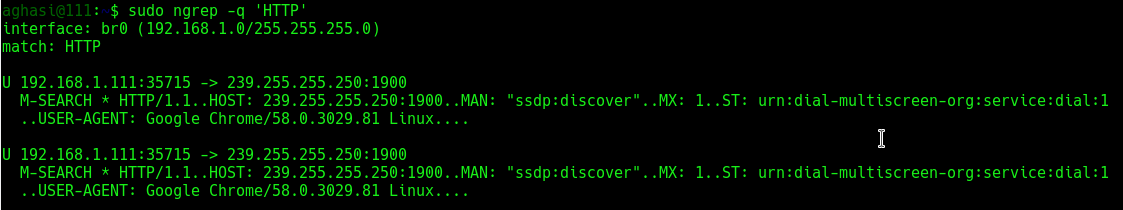
Monitor all interfaces and protocols for a string match of “HTTP“. The -q flag will quiet the output by printing only packet headers and relevant payloads:

$ sudo ngrep -q 'HTTP'

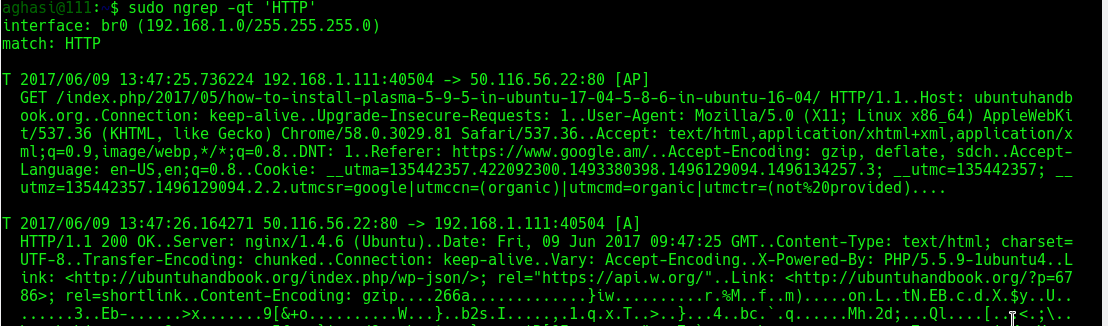
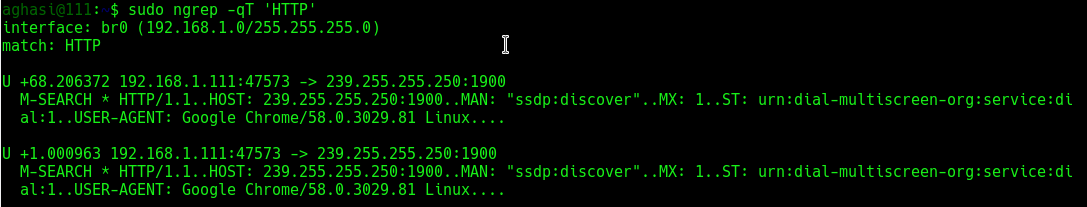
Use the -t flag to print a timestamp along with the matched information. Use -T to print the time elapsed between successive matches:

$ sudo ngrep -qt 'HTTP'

Monitor all activity crossing source or destination port 25 (SMTP):

$ sudo ngrep -d any port 25

Monitor any network-based syslog traffic for the occurrence of the word “error“. ngrep knows how to convert service port names (on Linux, located in /etc/services) to port numbers:

$ sudo ngrep -d any 'error' port syslog

Monitor any traffic crossing source or destination port 21 (FTP), looking case-insensitively for the words user or pass, matched as word-expressions (the match term(s) must have non-alphanumeric, delimiting characters surrounding them):

$ sudo ngrep -wi -d any 'user|pass' port 21

Monitor all traffic not going over port 22 (SSH):

$ sudo ngrep not port 22 | strings -n 8

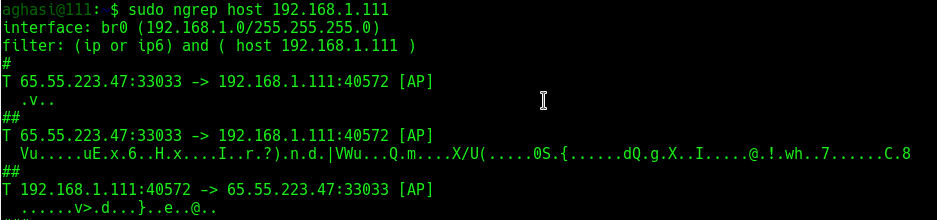
Monitor all traffic coming from a certain host:

$ sudo ngrep host 192.168.1.111

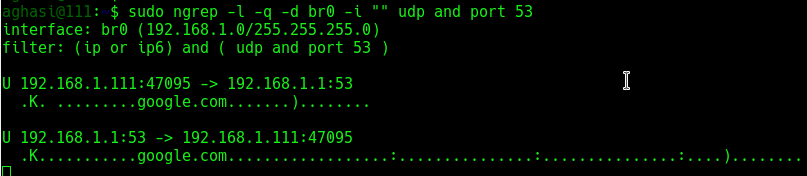
Capture network traffic incoming/outgoing to/from br0 interface and show the DNS (UDP/53) querys and responses:

$ sudo ngrep -l -q -d br0 -i "" udp and port 53

ngrep‘s syntax is similar to that of tcpdump:

$ sudo ngrep port 80 and src host 192.168.1.111 and dst host 192.168.1.1

Now let’s look for people misusing bandwidth:

$ sudo ngrep -i 'game*|chat|recipe' -W byline > bad_user.txt

To monitor current email transactions and print the addresses:

$ sudo ngrep -i 'rcpt to|mail from' tcp port smtp


Common BPF filters

The BPF specifies a rich syntax for filtering network packets based on information such as IP address. Matches all headers containing the string “HTTP” sent to or from the IP address starting with “192.168“:

$ sudo ngrep -q 'HTTP' 'host 192.168'

Will do as above, but instead match a destination host:

$ sudo ngrep -q 'HTTP' 'dst host 192.168'

Will do as above, but instead match a source host:

$ sudo ngrep -q 'HTTP' 'src host 192.168'

IP protocol:

$ sudo ngrep -q 'HTTP' 'tcp'
$ sudo ngrep -q 'HTTP' 'udp'
$ sudo ngrep -q 'HTTP' 'icmp'

Port number:

$ sudo ngrep -q 'HTTP' 'port 80'


Debugging HTTP interactions

In certain scenarios it is desirous to see how web browsers communicate with web servers, and to inspect the “HTTP” headers and possibly cookie values that they are exchanging:

$ sudo ngrep port 80

To see which files your browser is requesting any packet on the network which consists of “GET” followed by any characters but ending in “HTTP/1.0” or “HTTP/1.1“:

$ sudo ngrep -q '^GET .* HTTP/1.[01]'

Match only requests going to port 80:

$ sudo ngrep -q '^GET .* HTTP/1.[01]' 'port 80'

Match only requests going to the destination “1it.click“:

$ sudo ngrep -q '^GET .* HTTP/1.[01]' 'host 1it.click'

You can use regex such as ‘.*‘ in the search string:

$ sudo ngrep -d any "domain-.*.com" port 80

-W byline mode tells ngrep to respect embedded line feeds when they occur. You’ll note from the output above that there is still a trailing dot (.) on each line, which is the carriage-return portion of the CRLF { Carriage Return (ASCII 13, \r) Line Feed (ASCII 10, \n) } pair:

$ sudo ngrep -W byline port 80

Capture network traffic incoming/outgoing to/from br0 interface and show parameters following HTTP (TCP/80)GET or POST” methods

$ sudo ngrep -l -q -d br0 -i "^GET |^POST " tcp and port 80

Capture network traffic incoming/outgoing to/from br0 interface and show the HTTP (TCP/80)User-Agent: ” string

$ sudo ngrep -l -q -d br0 -i "User-Agent: " tcp and port 80

In the above command :
a) tcp and port 80 – is the BPF filter, that sniffs only TCP packet with port number 80
b) The -d option specifies the interface to sniff  ( br0 in this case)
c) "User-Agent: " is the string to search for all packets that have that string are displayed

Monitor specific traffic:

$ sudo ngrep -t '^(GET|POST|HEAD) ' 'dst host 216.58.210.14 and tcp and dst port 80'

Then send a header request to a specific URL:

$ curl -I google.com

Or, break the response by newlines:

$ sudo ngrep -t '^(GET|POST|HEAD) ' 'dst host 216.58.210.14 and tcp and dst port 80' -W byline


Processing PCAP dump files, looking for patterns

Timestamp all traffic on port 53 (DNS) on all devices (if the box has multiple devices) and send the output to a pcap file specified by the -O switch:

$ sudo ngrep -O /tmp/dns.dump -d any -T port domain

Now we have a PCAP dump file, and so let’s search for the letter ‘m‘ for some patterns:

$ sudo ngrep -w 'm' -I /tmp/dns.dump

Here we’ve added -t which means print the absolute timestamp on the packet, and -D which means replay the packets by the time interval at which they were recorded. The latter is a neat little feature for observing the traffic at the rates/times they originally seen, though in this example it’s not terribly effective as there is only one packet being matched.

$ sudo ngrep -tD ns3 -I /tmp/dns.dump
$ sudo ngrep -I /tmp/dns.dump port 80

There’s no port 80 traffic in the dump, so of course the BPF filter yields us no results.


Debugging MySQL

Show the query and results of SELECT queries going to your MySQL server:

$ sudo ngrep -d br0 -i 'select' port 3306

Show the query and results of all queries going to your MySQL server:

If the following MySQL query returns the following:

$ sudo mysql -h 127.0.0.1 -B -e 'select * from user;' mysql

Watch the traffic:

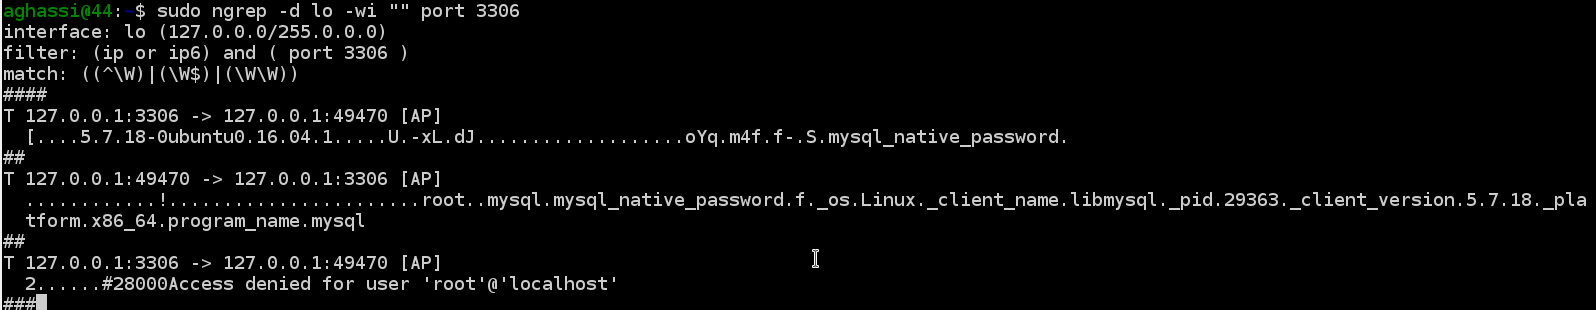
# sudo ngrep -d lo -wi "" port 3306