Create Docker Swarm


Docker Swarm

Swarm is native clustering for the Docker. When the Docker Engine runs is swarm mode, manager nodes implement the Raft Consensus Algorithm to manage the global cluster state. The reason why Docker swarm mode is using a consensus algorithm is to make sure that all the manager nodes that are in charge of managing and scheduling tasks in the cluster, are storing the same consistent state.


LAB Setup

In this LAB we are going to create a Swarm cluster with single manager and 2 worker nodes.

Operating System CentOS 7.4 x86_64
Platform Vagrant Machines
Manager Node manager 192.168.11.100/24
Worker Node 1 node-1 192.168.11.101/24
Worker Node 2 node-2  192.168.11.102/24

Prerequisites

  • Docker Engine 1.12 or later installed. We are going to install “ce” (community engine)

# yum-config-manager --add-repo https://download.docker.com/linux/centos/docker-ce.repo

# yum install docker-ce -y

# systemctl start docker.service

# systemctl enable docker.service

  • Static IP address of the manager machine, preferably for all machines
  • Network connectivity between all nodes and manager
  • Following Open Network ports

TCP port 2377 for cluster management communications

TCP and UDP port 7946 for communication among swarm nodes

UDP port 4789 for overlay network traffic


Create a Swarm

After the installation of the docker engine, next step is to enable the swarm mode, by default it is disabled.


Step-1: Initialize the Swarm

To crate a new swarm run the below command on the manager node.

# docker swarm init --advertise-addr 192.168.11.100

This command switches the current node into swarm mode and creates a new swarm. On the node where swarm init is done, that node is designated as manager node and it starts on listening on the advertised IP address over port 2377.

With swarm init – by default, generates tokens for worker and manager nodes to join the swarm, you can regenerate the tokens again, if missed to node those.


Step-2: Adding worker nodes on the swarm cluster

Login to every swarm node-1 and node-2 and run the following command

# docker swarm join --token <TOKEN> <Manager IP>:2377

Step-3: Check the Status of the Swarm Cluster

Run the following commands to check the status and health of swarm cluster.

# docker info

# docker node ls

# docker node inspect <node> --pretty

Please Note – By default manager also acts as worker node.


To see the Token

Display the token for manager to join

# docker swarm join-token manager

Display the token for worker to join

# docker swarm join-token worker


Swarm Cluster Management

AVAILABILITY column shows whether or not the scheduler can assign tasks to the node:

active: scheduler can assign tasks to the node.

pause: scheduler doesn’t assign new tasks to the node, but existing tasks remain running.

drain: scheduler doesn’t assign new tasks to the node, existing services will move to other nodes.

MANAGER STATUS column shows node participation in the Raft consensus:

No value: indicates a worker node that does not participate in swarm management.

leader: node is the primary manager that makes all swarm management and decisions.

reachable: node is a manager node participating in the Raft consensus quorum.

unavailable: node is a manager that is not able to communicate with other managers.


Management Commands

Update the states of manager/worker node

# docker node update --availability drain node-1.1it.click

Promote the node as manager

# docker node promote node-1.1it.click

Demote the node from manager role

# docker node demote node-2.1it.click

Add labels to the Node’s metadata

# docker node update --label-add Env=Dev node-2.1it.click

Node leaves the cluster

# docker swarm leave

Removes the node from cluster

# docker node rm node-2.1it.click

Docker Swarm


Docker Swarm

Swarm is native clustering for the Docker. in the context of swarm, a cluster is a poll of Docker hosts that acts as a bit like a single large docker host. You can also run swarm services and standalone containers on the same Docker instances.


Features of Swarm

  • Swarm setup is very quick and easy, no separate infrastructure requirements and Swarm ships as standard Docker image.
  • Swarm implements most of the Docker API endpoints, which means tools build on it can work out of the box.
  • Swarm support Affinity definition/configuration, which means Docker swarm launch a container only a Docker host that does not already have the same container already running on.
  • Swarm supports high availability, we can join multiple manager nodes to the cluster, so that if one manager node fails, another can automatically take its place without impact to the cluster.
  • Swarm support scaling, for each service you can declare the number of tasks you want to run. When you scale up or down, the swarm manager automatically adapts by adding or removing tasks to maintain the desired state.
  • Swarm handles desired state reconciliation very well, manager node constantly monitors the cluster state and reconciles any differences between the actual state and your expressed desired state.
  • Swarm support network overlays. The swarm manager automatically assigns addresses to the containers on the overlay network when it initializes or updates the application.
  • Swarm is secure by default. Each node in the swarm enforces TLS mutual authentication and encryption to secure communications between itself and all other nodes.
  • Rolling updates: At roll out time you can apply service updates to nodes incrementally.


Swarm Mode Key Concepts

Manger Node manages the application deployment of the request. Task Manager Node performs are

  • Dispatches units of work called tasks to worker nodes.
  • Checks are manage desired state of the swarm.
  • Manger nodes elect a single leader to conduct orchestration tasks.
  • Keep track of resource utilization on the worker nodes.

Worker nodes receive and execute tasks dispatched from manager nodes. By default manager nodes also run services as worker nodes, but you can configure them to run manager tasks exclusively and be manager-only nodes. An agent runs on each worker node and reports on the tasks assigned to it. The worker node notifies the manager node of the current state of its assigned tasks so that the manager can maintain the desired states.

Service is the definition of the tasks to execute on the worker nodes. It is the central structure of the swarm system and the primary root of user interaction with the swarm. When you create a service, you specify which container image to use and which commands to execute inside running containers.

Task carries a Docker container and the commands to run inside the container. It is the atomic scheduling unit of swarm. Manager nodes assign tasks to worker nodes according to the number of replicas set in the service scale. Once a tasks is assigned to a node, it cannot move to another node. It can only run on the assigned node or fail.

Load balancing, The swarm manager uses ingress load balancing to expose the services you want to make available externally to the swarm. The swarm manager can automatically assign the service a Published Port in the 30000-32767 range. Otherwise you can choose free port yourself.

DNS component automatically assigns each service in the swarm a DNS entry. The swarm manager uses internal load balancing to distribute requests among services within the cluster based on the DNS name of the service.

Docker Image Creation


Docker Image

Docker image can be described as a template with all required configurations Whereas a container is a  running instance of Docker image. Like containers, image are not bound to the states i.e. Image does not have states.

There are different images available from the OS/Application vendor along with the custom images from the community.

When working on container a DevOps/Application engineer generally create their own Docker image with all the customization, this enable them to launch a container quickly.


Methods for custom image creation

Interactive Method:

In this way, you can download the base Docker OS image -> create container -> manually launch a shell -> perform the customization -> commit the changes.

This process will save your container to a Docker image and that image can be stored/distributed.

Automated  method using Dockerfile:

Dockerfile is text file with the directives/instructions for the image creation. “docker build” command is used to build the image which creates/configures the image automatically by reading Dockerfile. Dockerfile accept the in the following format

DIRECTIVE               arguments

In the last session on “Docker”, we have covered the “interactive way” of image creation and in this session we are going to create a Docker image using the Dockerfile method.


LAB

Using the Dockerfile, we are going to create an Apache HTTPD Web server on CentOS 7 image, At high level below configuration will be performed/applied to the Docker image.

  • Download the official CentOS 7 image.
  • Perform package update on the image.
  • Install Apache HTTP server.
  • Add a directive to include/copy the index.html from Docker mgmt server to document root ( i.e. /var/www/html ) of the image.
  • Enable port 80 for automatically whenever a container created from this image.
  • Configure the auto start-up of Apache HTTPD service.

Below are the directives we are going to use in the Dockerfile.

FROM :   this directive tells which base image to be used to create the custom image, example centos/ubuntu etc.

RUN    :       this directive is use to define the command to be executed during the image build.

ADD    :      this directive is used to defines the files/directories to be copied from the source (local server) to the image during image build.

ENTRYPOINT :     this directive defines container as executable.

CMD :             this directive is used to define the arguments for the ENTRYPOINT command.

EXPOSE :  this directive defines the network ports on which container will listen.


Sample Dockerfile

#  use latest centos7 image

FROM centos:latest

#  add the image maintainer name and email id

MAINTAINER Aghassi email: [email protected]

# update the centos image with latest available updates

RUN yum update -y

RUN yum clean all

# install network utilities, such as ( ifconfig, netstat, etc)

RUN yum install net-tools -y

# install apache httpd web server

RUN yum install httpd -y

RUN yum clean all

# copy the index.html file from current directory to image's document root

ADD index.html /var/www/html/

# define image to allow listen on port 80 (whenever a container created)

EXPOSE 80

# define the commands to be executed when container boots (created from this image)

ENTRYPOINT [ "/usr/sbin/httpd" ]

CMD [ "-D",  "FOREGROUND" ]


Bulid image

# docker build -t [repository/image_name]:[tag] .


Test the newly created image by creating a container

# docker run -it -d -P [image id]

#curl [container IP]:80


Customize The Docker Networking


Why to use custom Network Subnet for Docker Networking?

Docker container makes use of default subnet "172.17.0.0/16" for Networking. There may be many scenarios where we can’t use the default network due to some restrictions or in case subnet already used in the network.


Lab Tasks

In this quick session, we will change the network from default subnet "172.17.0.0/16" to "10.10.10.10/24". The bridge interface is remain to docker0 i.e. default.


Configure the Custom Network

Stop The Docker Service

# systemctl stop docker.service

Bring down the Docker bridge docker0

# ip link set dev docker0 down

Verify if IP forwarding is enabled, if not enable it in sysctl.conf

# sysctl net.ipv4.conf.all.forwarding

Update new subnet in the /etc/sysconfig/docker-network add the following to DOCKER_NETWORK_OPTIONS:

"--bip=YOUR>CIDR>ADDRESS/24"

Example

DOCKER_NETWORK_OPTIONS="--bip=10.10.10.10/24"

Remove default subnet’s MASQUERADE rules from the POSTROUTING chain in network iptables:

# iptables -t nat -F POSTROUTING

# iptables -t nat -F DOCKER

Start Docker service:

# systemctl start docker.service

Verify that the MASQUERADE rule have new subnet added to the POSTROUTING chain:

# iptables -t nat -L -n


Validation

Check the new subnet is on the bridge now:

# docker network inspect bridge

Check IP Address of the Container

# docker inspect -f '{{ .NetworkSettings.IPAddress }}' [Container ID]

Run a docker container and check container have

# docker run -it [Container Name] /bin/bash


Docker


What is Docker?

Docker is an open platform for developers and system engineers to build, ship, and run distributed applications, whether on Bare Metal System (Physical), VMs, or the Cloud, Docker is not a container technology like Xen/KVM etc.

Docker provides an additional layer abstraction and automation of operating system I virtualization on Linux.


Advantages of using Docker

Portability – In Docker system, an application and its prerequisites/dependencies can be bundled into a single container/image, whish will be independent of host kernel, can be easily ported to different system.

Quick Application Deployment – As application and its dependencies can be bundled into single images, it makes easy to quickly deploy the apps.

Sharing – You can share your Docker image with other using remote repositories.

Lightweight – Docker images have very small, they need very low compute capacity and storage, …

Easy Maintenance – Maintenance is very quick and easy.

Cost Saving – Open Source technology and don’t need heavy compute.


Docker Containers vs. Virtual Machines

  • Docker container can be created/destroyed very quickly as compare to the virtual machines.
  • Docker containers are light weight is compare to the virtual machines. Being lightweight more containers can run at some time on a host.
  • Docker container make use of resources very efficiently. In case of virtual machines capacity is need to be reserved (compute + storage), whereas this is not needed is case of Docker containers.
  • Virtual Machines can be migrated across servers when they are running, but Docker need to stopped before migration as there is no hypervisor layer.


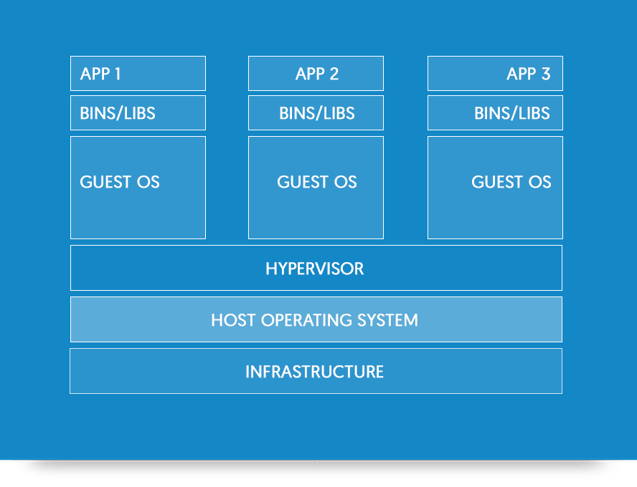
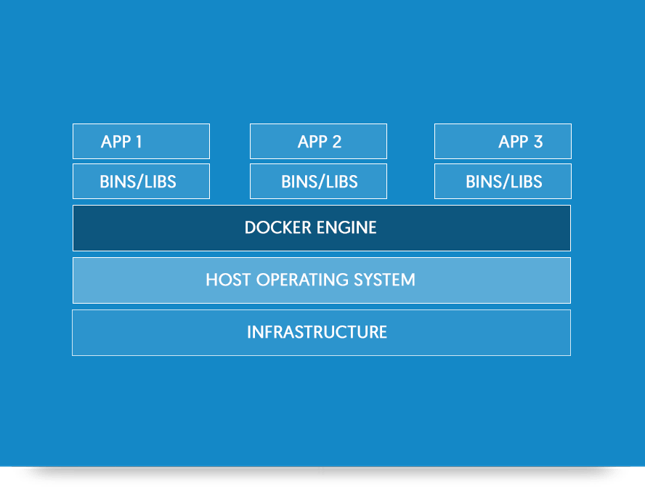
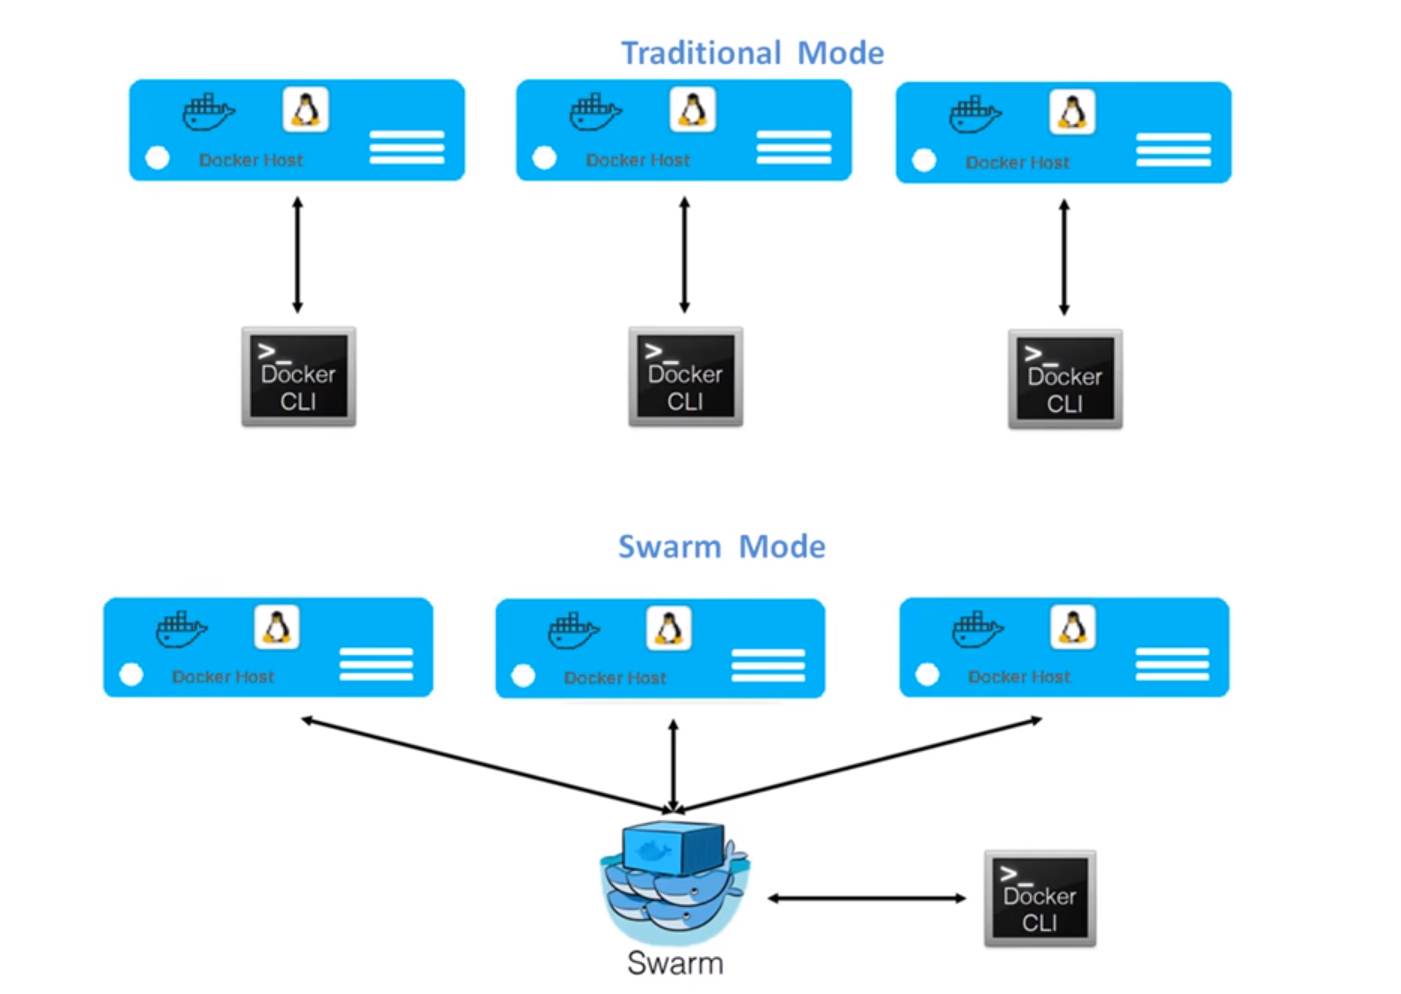
*Images taken from Docker Documentations


Docker Terminologies

  • Images – Images are templates for the docker containers.
  • Containers – created from Docker images and run the actual application.
  • Docker Daemon – The background service running on the host that manages building, running the containers.

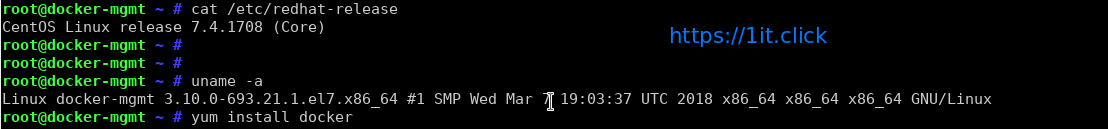
Prerequisites Docker Installation

  1. CentOS 7 64 Bit / Kernel 3.10.x kernel in the minimum required.
  2. Disabled the SELinux and FirewallD services:  # systemctl stop firewalld
  3. Install EPEL repository:    # yum install -y epel-release

 Install Docker via yum provided by CentOS (method 1)

# yum install -y docker


Install Docker CE (community edition)  Software (method 2)

First remove older version of docker (if any):

# yum remove docker docker-client docker-common docker-selinux docker-engine-selinux docker-engine docker-ce

Next install needed packages:

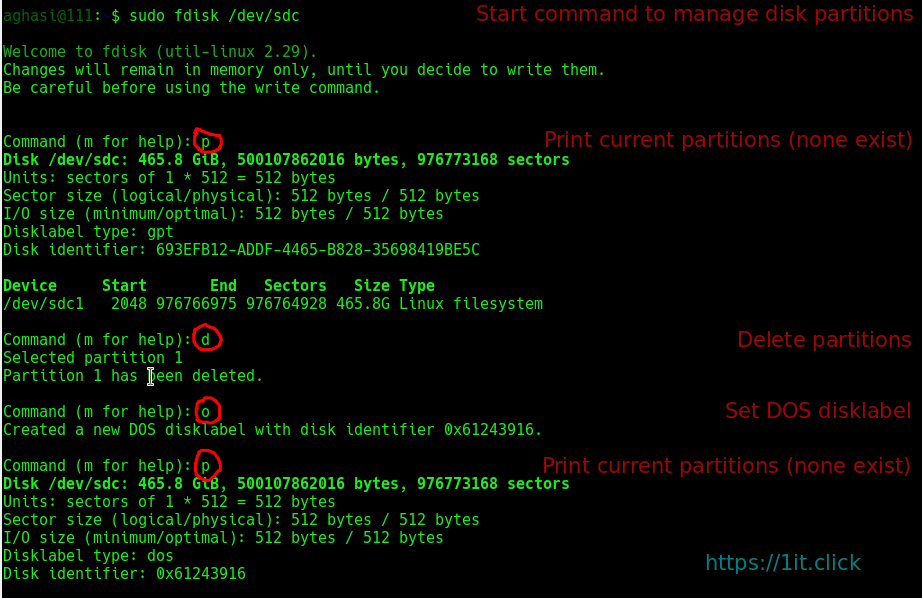
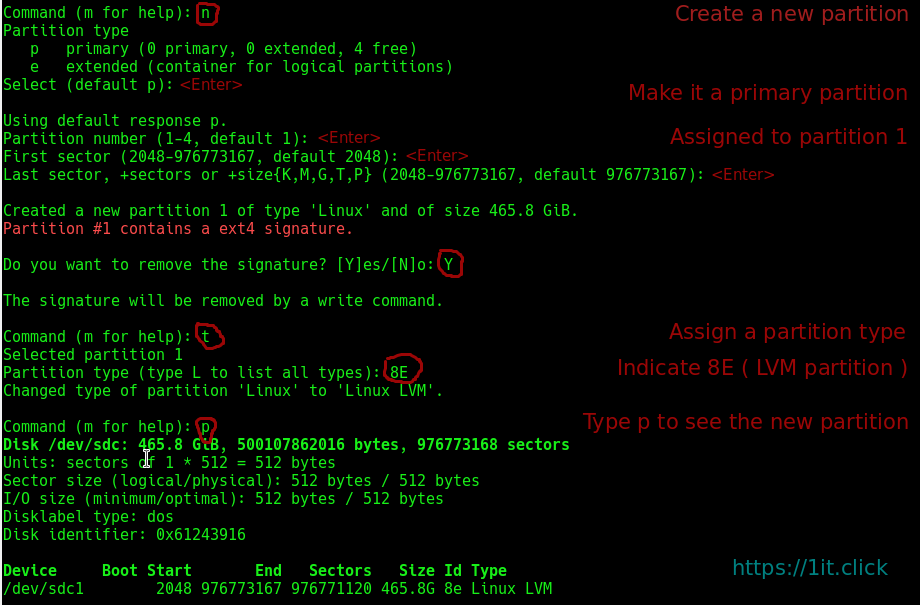
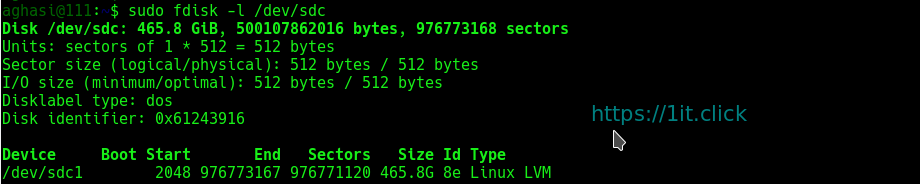
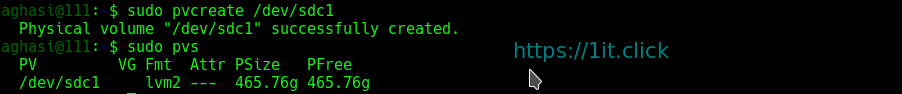
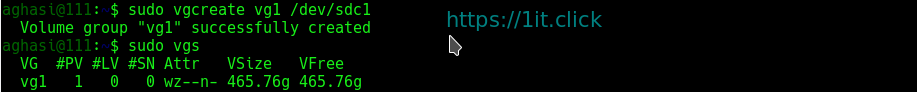
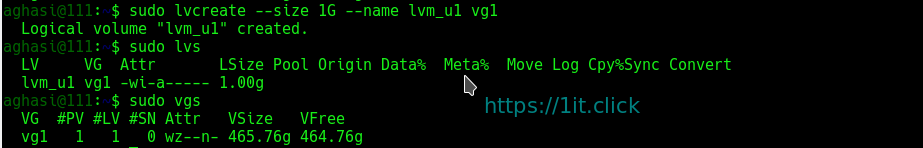
# yum install yum-utils device-mapper-persistent-data lvm2 -y

Configure the docker-ce repo:

# yum-config-manager --add-repo https://download.docker.com/linux/centos/docker-ce.repo

Finally install docker-ce:

# yum install docker-ce -y


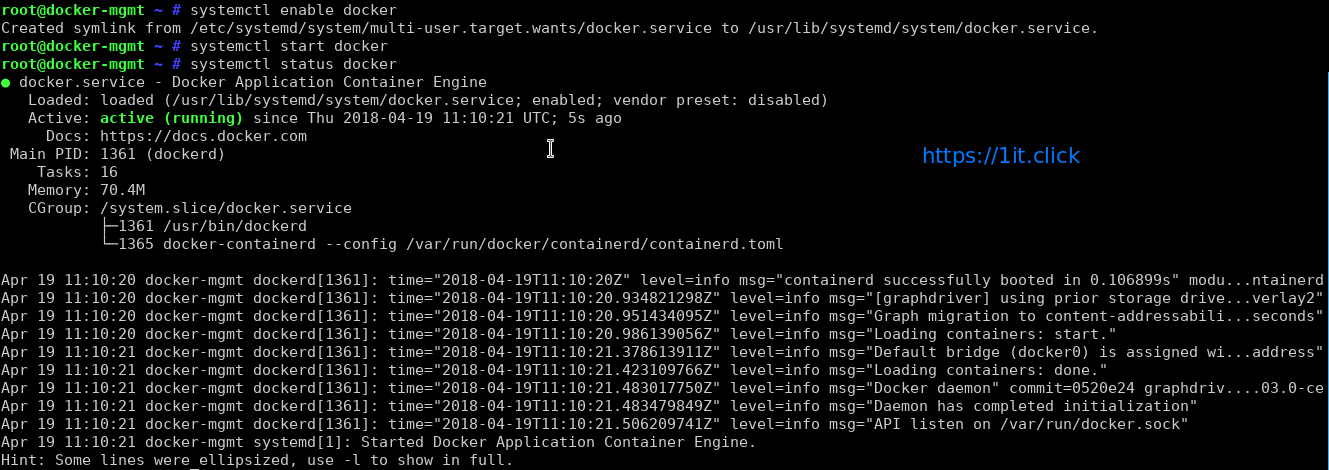
Enable and Start Docker service

# systemctl enable docker
# systemctl start docker


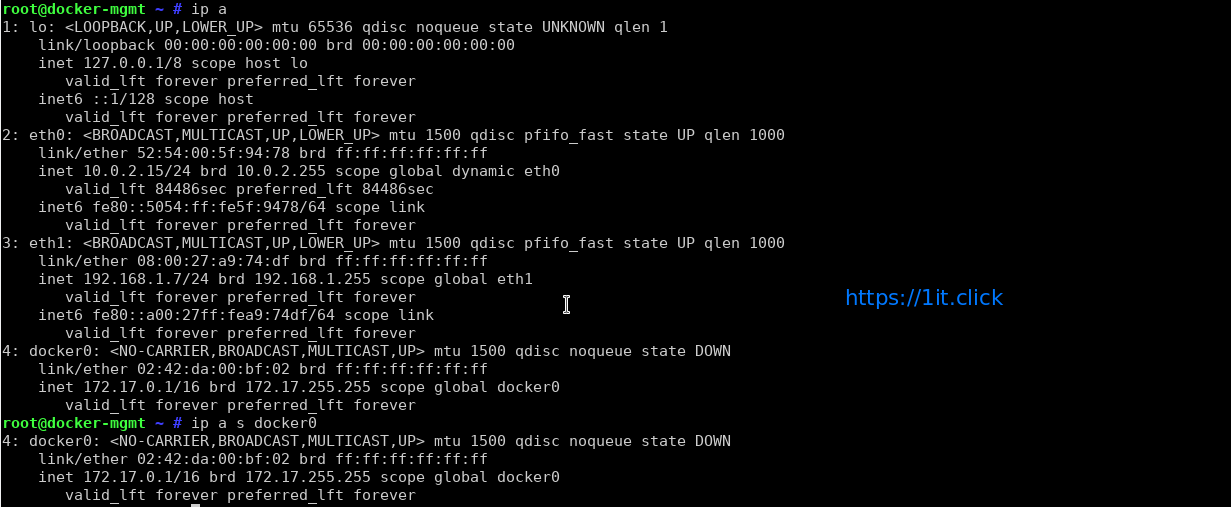
How to find out info about Docker network bridge and IP addresses

Default network bridge named as docker0 and is assigned with an IP address. To find this info run the following:

# ip a

# ip a s docker0


How to run docker commands

The syntax is:

# docker command
# docker command arg
# docker [options] command arg
# docker help | more


Getting help

# docker help | more

Run ‘docker COMMAND --help‘ for more information on a command:

# docker ps --help
# docker cp --help


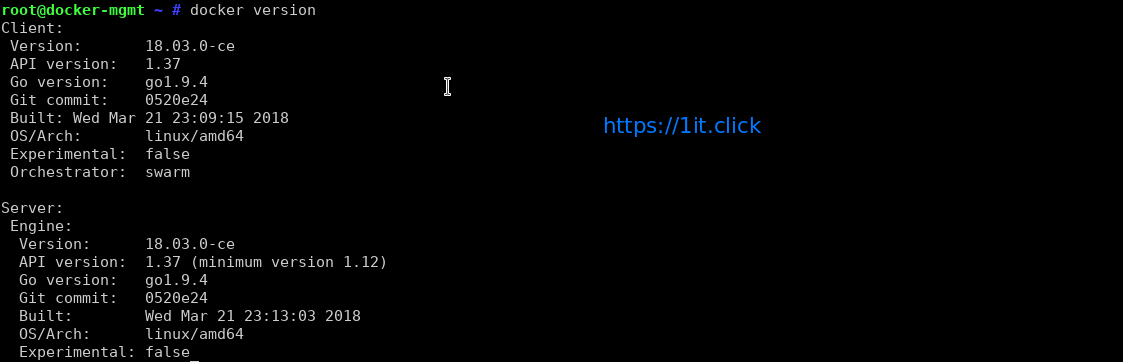
Check the Docker version

# docker version


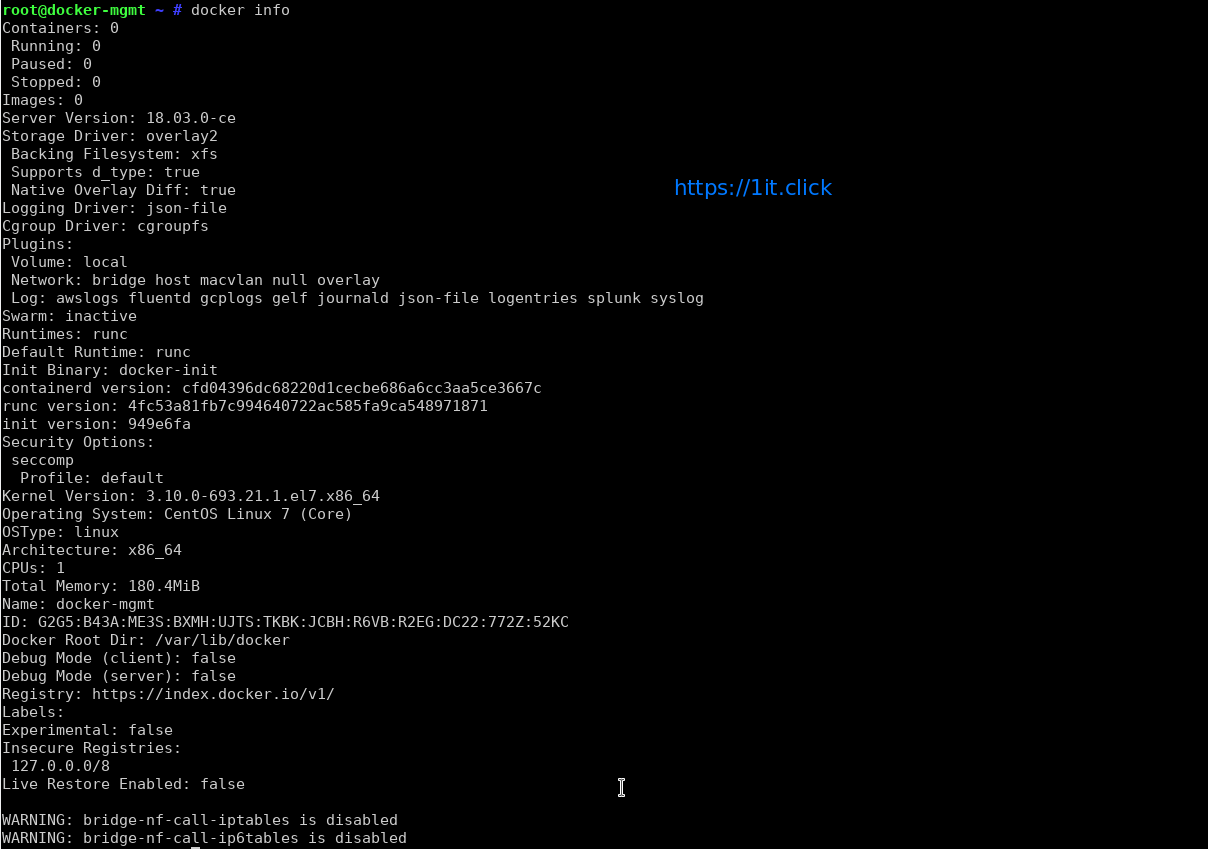
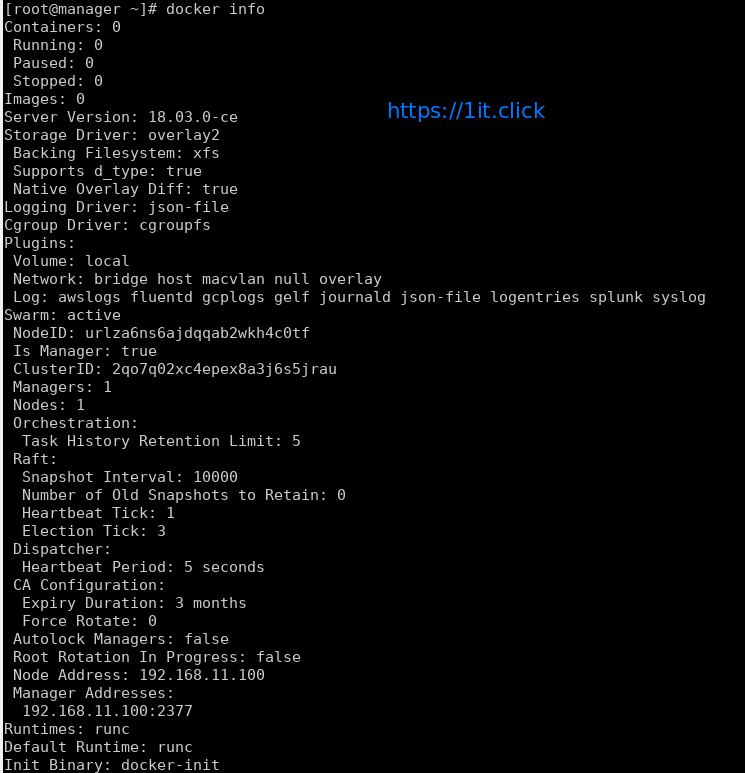
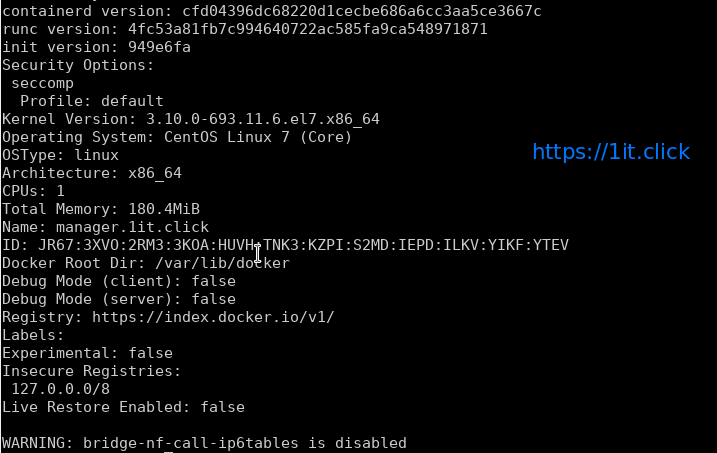
Check Detailed Docker Information

# docker info


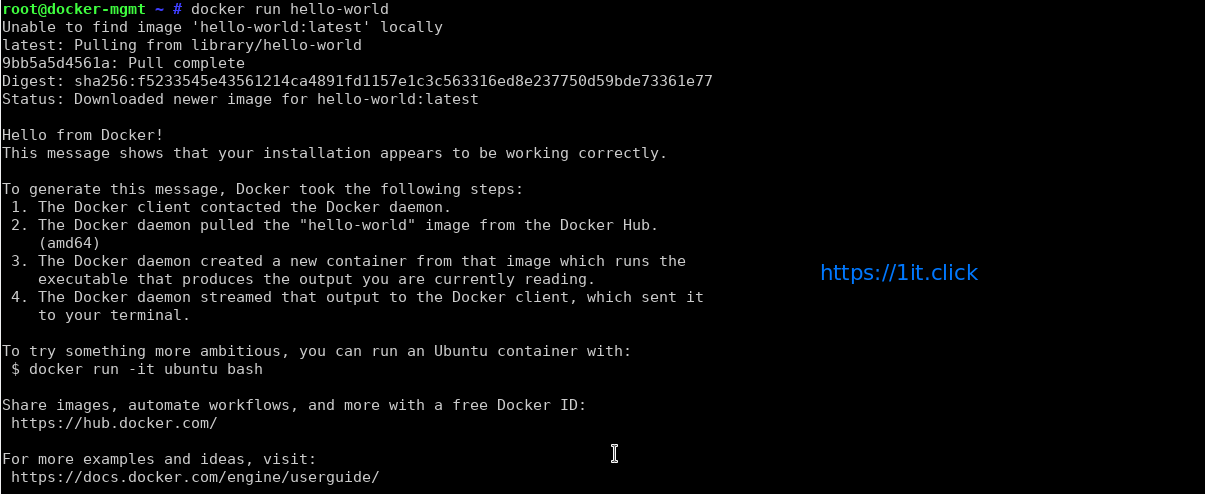
How to test your docker installation

Docker images are pulled from docker cloud/hub such as docker.io or registry.access.redhat.com and so on. Type the following command to verify that your installation working:

# docker run hello-world


Search Docker Images on Internet

Now you have working Docker setup. It is time to find out images. We can find images for all sort of open source projects and Linux distributions. To search the Docker Hub/cloud for centos or nginx image run:

# docker search centos
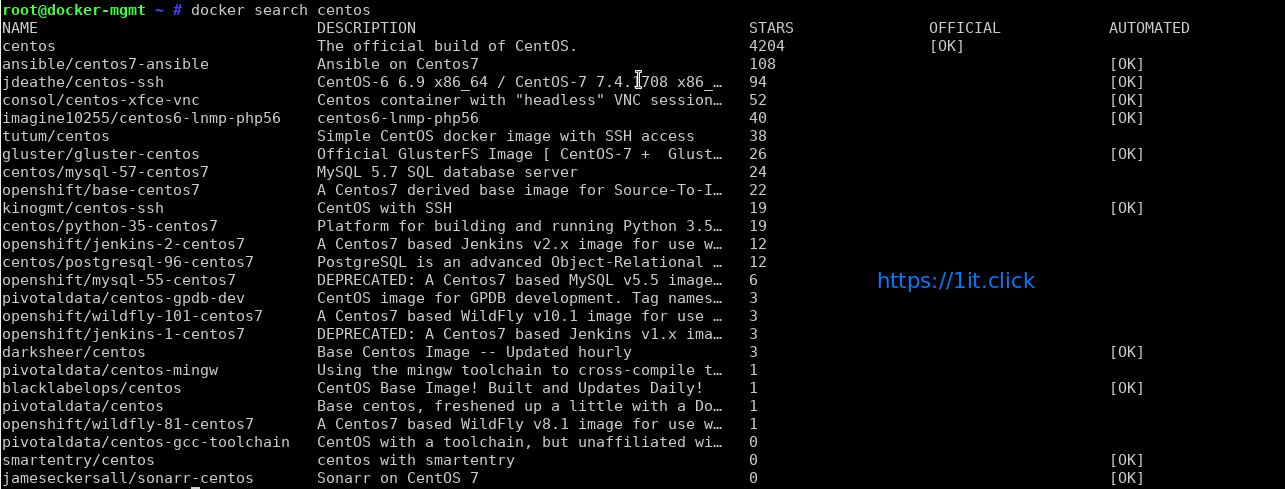

# docker search nginx


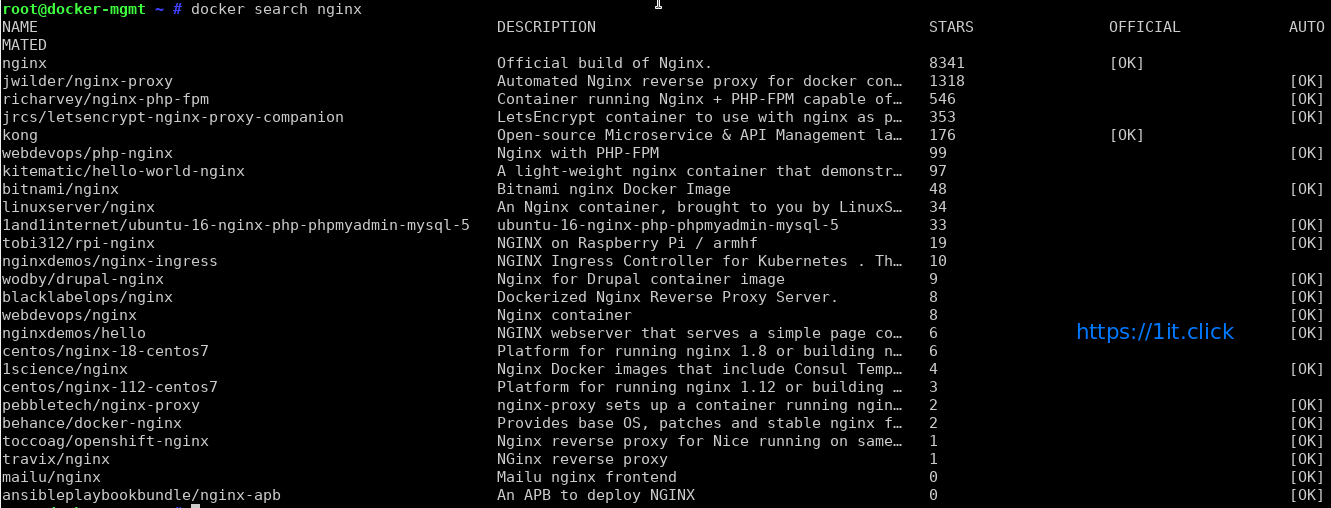
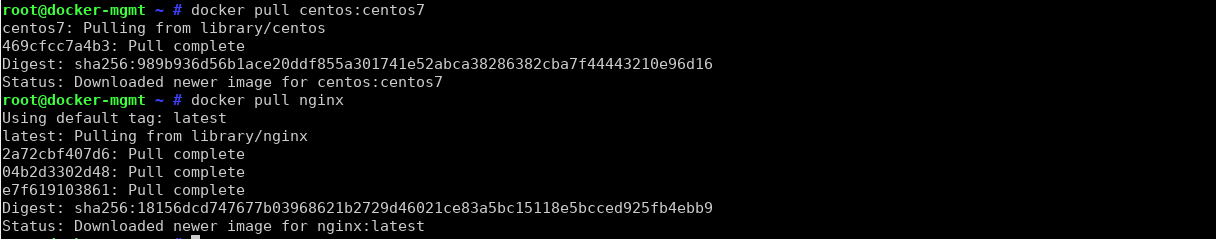
Download Docker Images

To pull an image named centos or nginx from a registry, run:

# docker pull centos:centos7

# docker pull nginx


To Display the list of locally available images

# docker images


TAG − This is used to logically tag images.
Image ID − This is used to uniquely identify the image.
Created − The number of days since the image was created.
Virtual Size − The size of the image. 
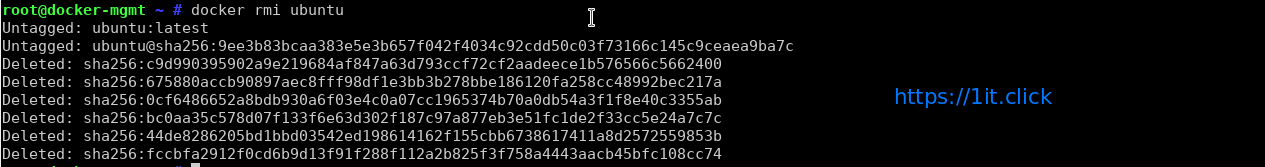

Remove Docker Image

When you have lots of running which are obsolete or you no longer need any Docker image then you can remove that image using the following command.

# docker rmi [IMAGEname]


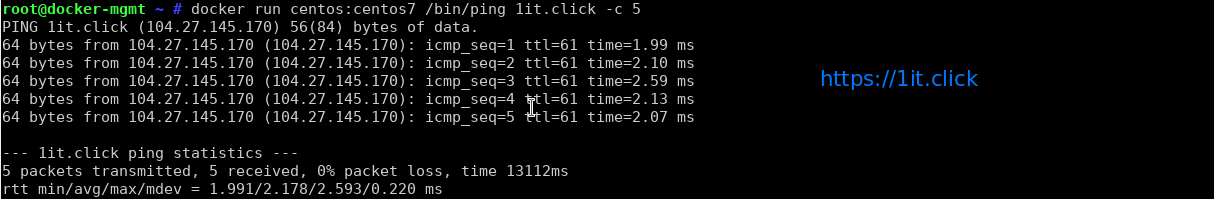
To test your new image

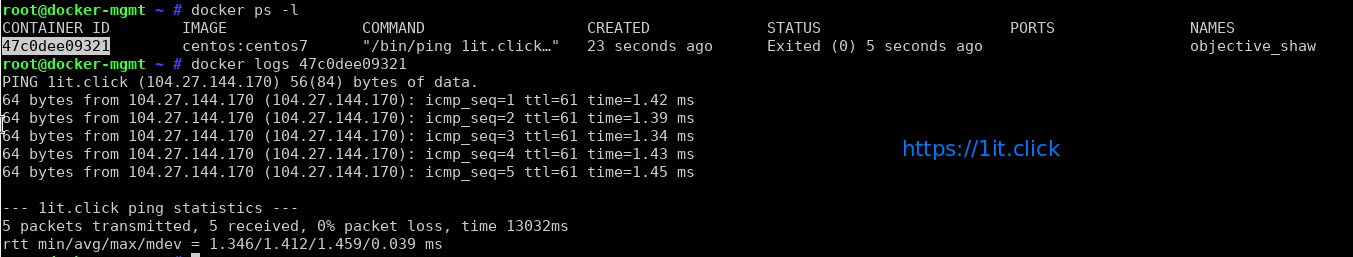
The concept is little catchy, whenever a command is sent for execution in the Docker image, a container in obtained. When this command execution is finished, the container gets stopped (a non-running or exited container state). It Means at every command execution into the same image a new container is created again and again and exited.

# docker run centos:centos7 /bin/ping 1it.click -c 5


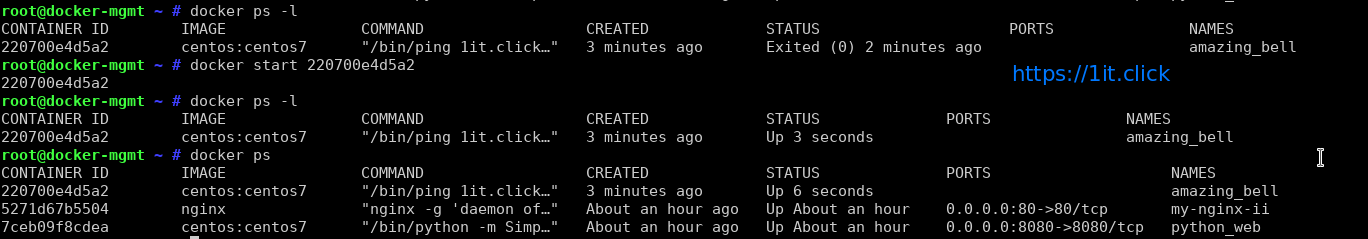
List Docker Containers

Whenever a command execution is performed on a Docker Image a container is created and gets stopped after execution but it remains in exited or non-running state. The following command will display a list of the running and stopped (non-running) containers:

# docker ps -l

In a production environment there are many running containers and to list them we have command. This command is used to get the currently running containers:

# docker ps

This Can also be used with -a argument and this command will list all of the containers on the system:
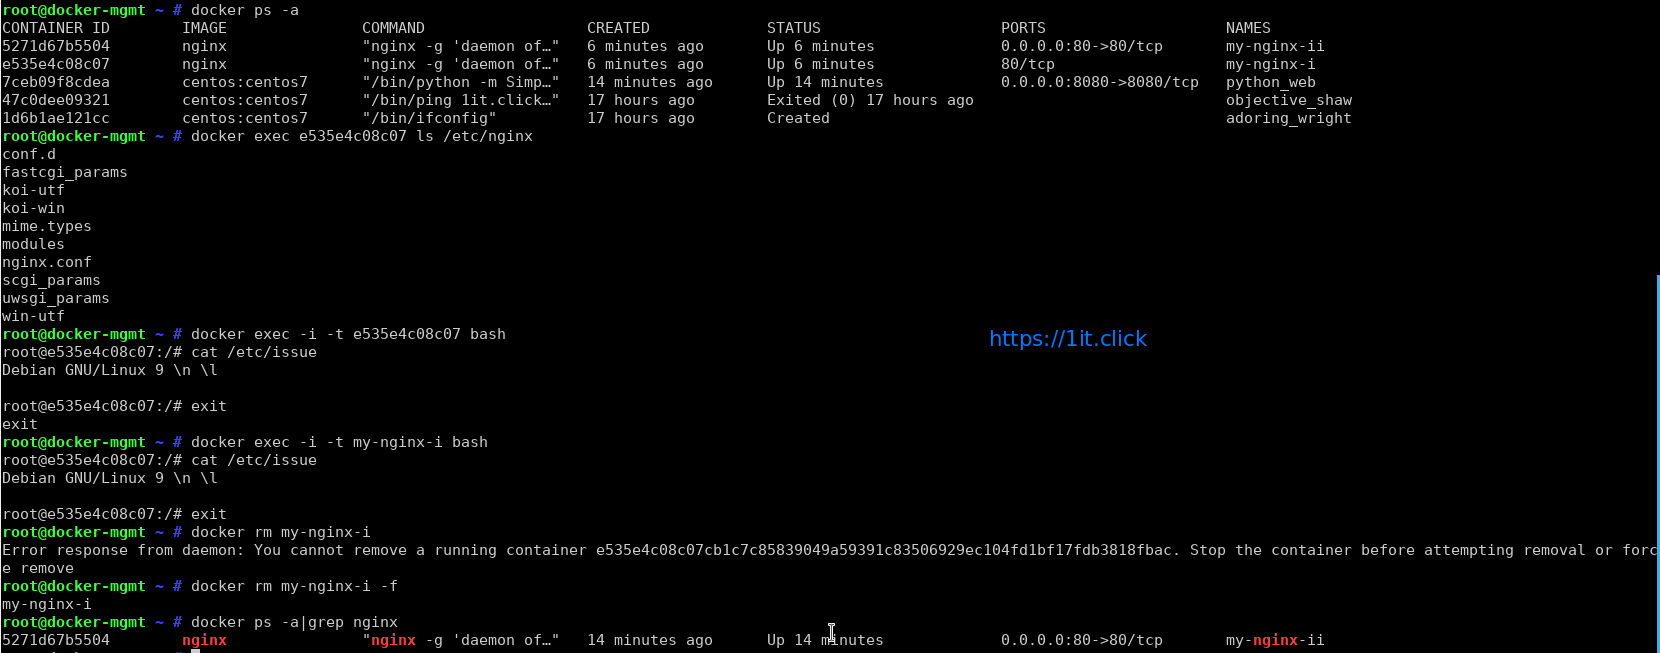
# docker ps -a


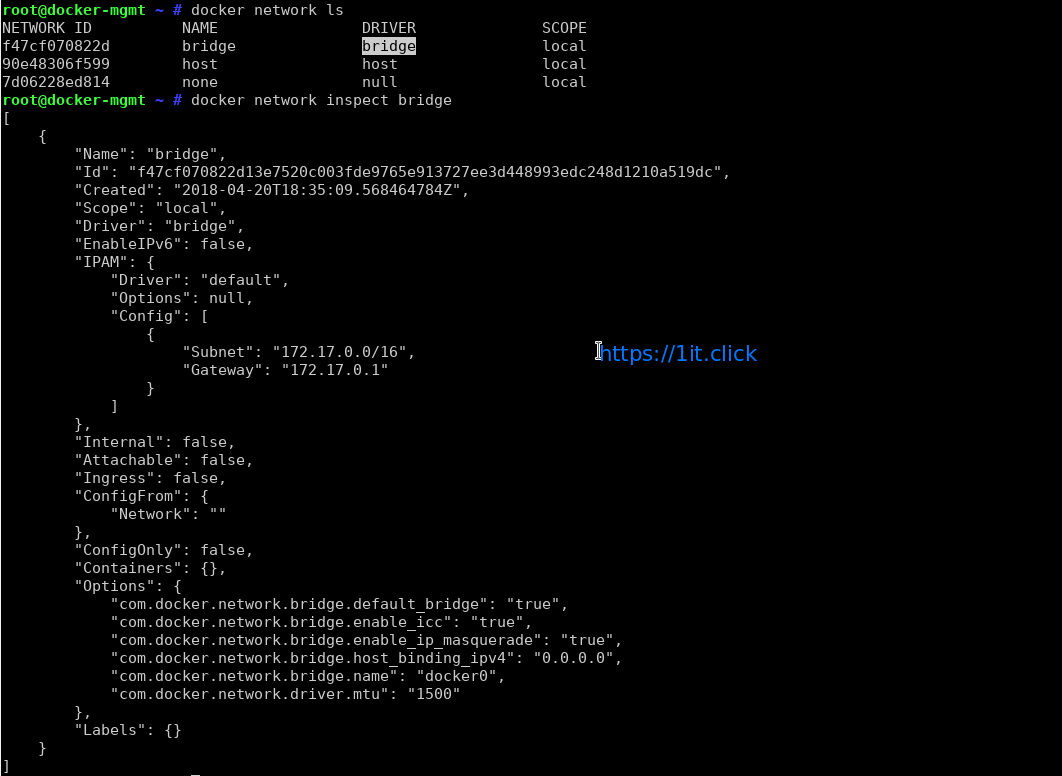
Checking Docker Networking

# docker network ls

# docker network inspact [network name]


Checking Resource Consumption by Running Container

# docker stats


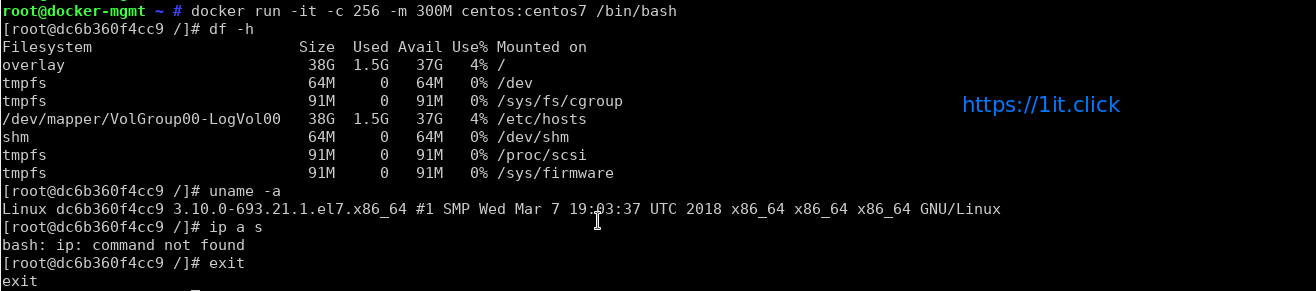
Check Resource limits for a docker container

# docker run -it -c 256 -m 300M centos:centos7 /bin/bash


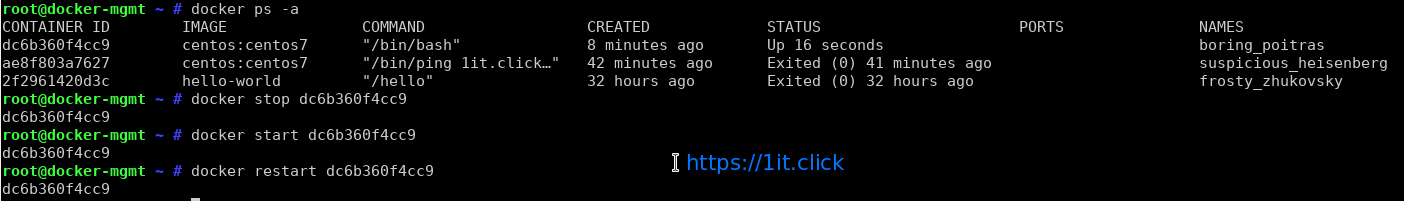
Stop/Start/Restart operation

# docker start [container ID]                ## to start a docker container

# docker stop [container ID]                 ## to stop a docker container

# docker restart [container ID]              ## to restart a docker container


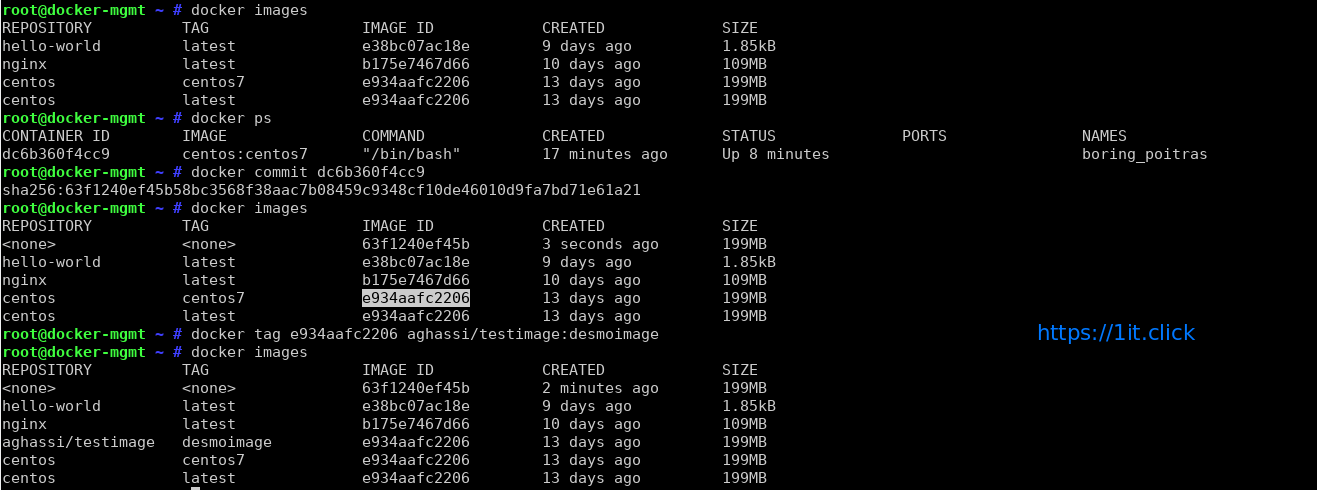
Committing the Docker Container Updates (This command turns your container to an image) And Adding a Repository/Tag value to a image

# docker commit [container ID]

# docker tag [image ID] <repo : tags>

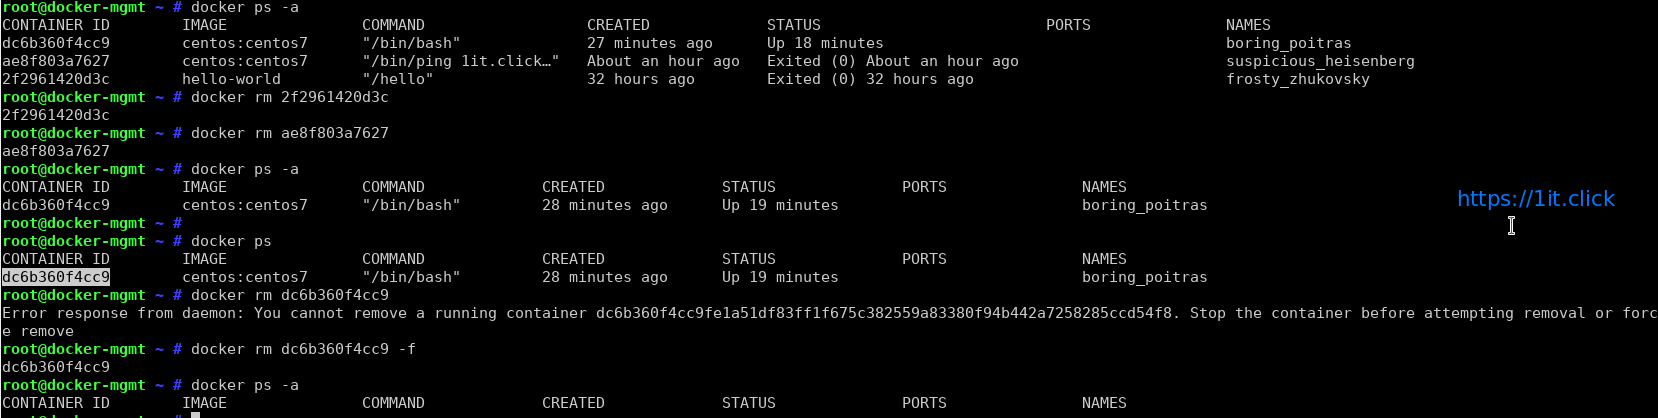
Removing/Deleting a container

# docker rm [container ID]


Checking the docker container Logs

# docker logs [container ID]


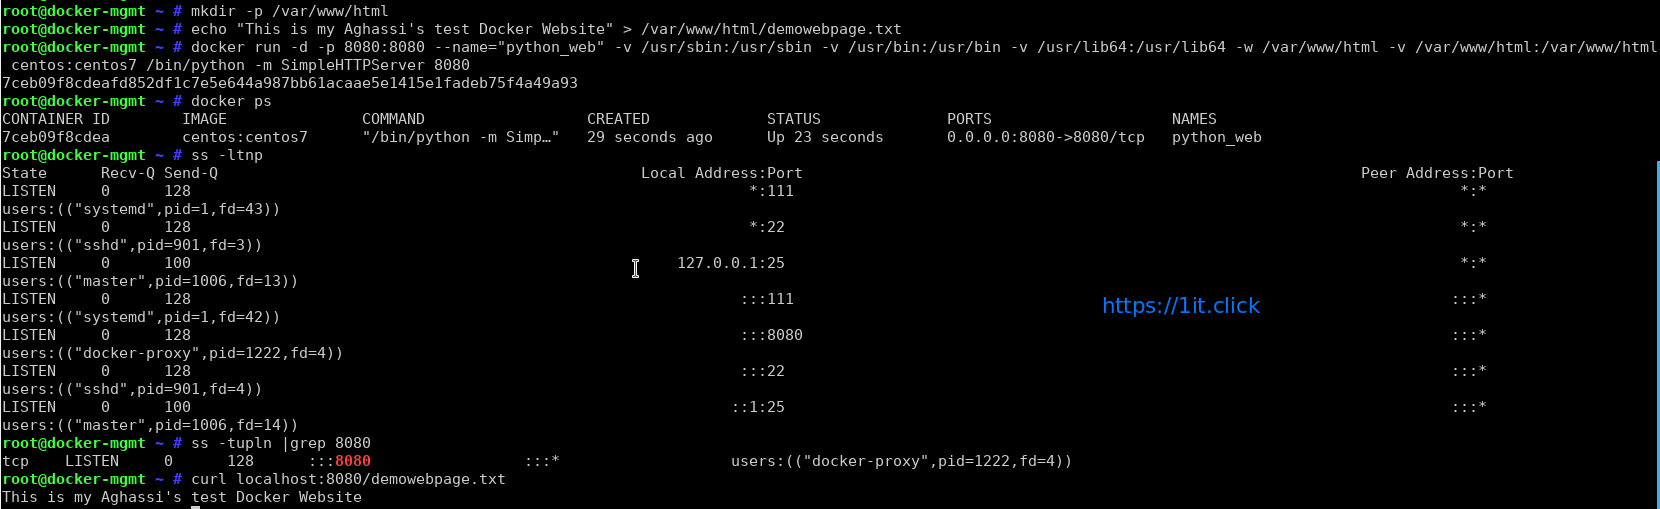
Lets create our container and hots a demo website quickly using Python Simple HTTP Server module quickly will listen on port 8080:

# mkdir -p /var/www/html

# echo "This is my Aghassi's test Docker Website" > /var/www/html/demowebpage.txt

# docker run -d -p 8080:8080 --name="python_web" -v /usr/sbin:/usr/sbin -v /usr/bin:/usr/bin -v /usr/lib64:/usr/lib64 -w /var/www/html -v /var/www/html:/var/www/html centos:centos7 /bin/python -m SimpleHTTPServer 8080

-d, –detach                             Run container in background and print container ID

-p, –publish list                     Publish a container’s port(s) to the host (default [])

-v, –volume list                     Bind mount a volume (default [])

-w, –workdir string              Working directory inside the container

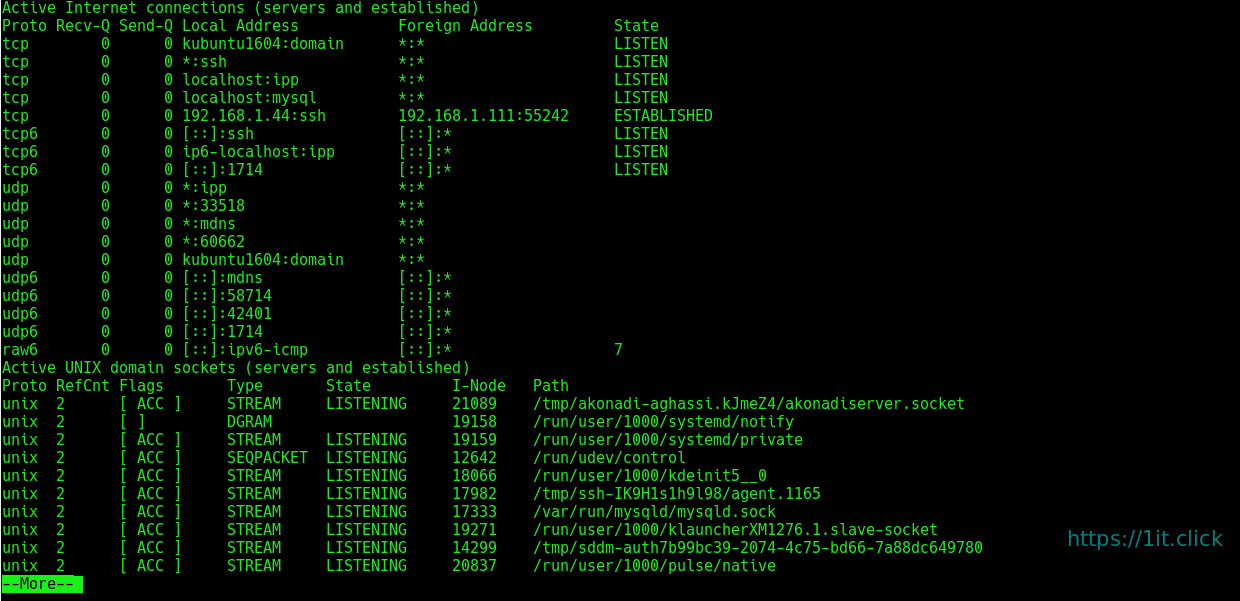
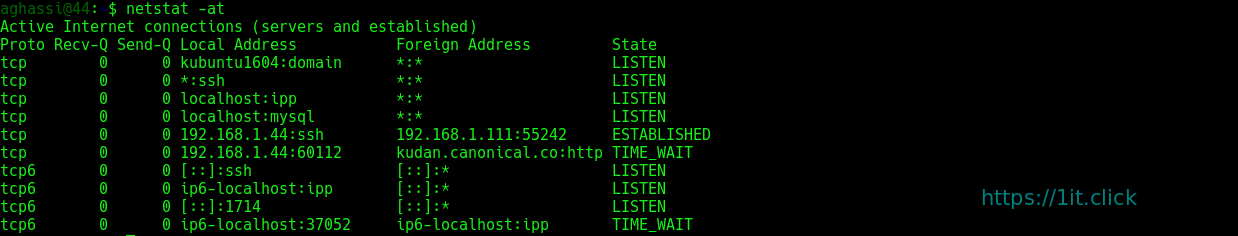
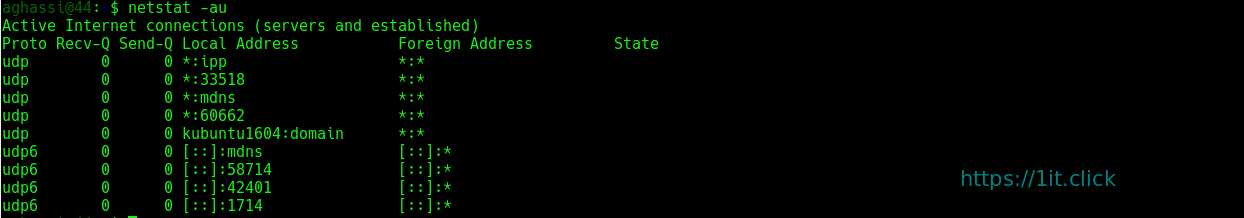
Check the network ports allocation:

# ss -tupln |grep 8080

Lets test the website:

# curl localhost:8080/demowebpage.txt


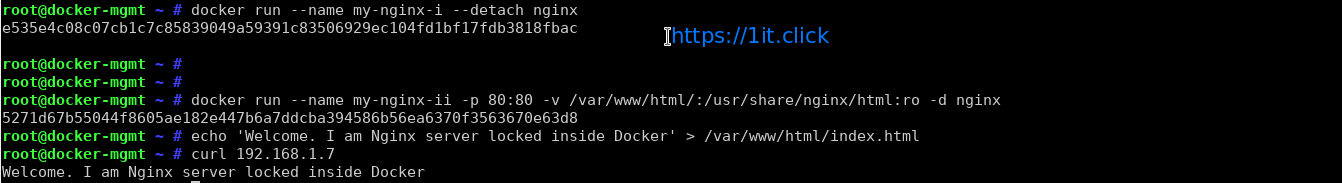
How to run Docker nginx image

Now you pulled nginx image, it is time to run it:

# docker run --name my-nginx-i --detach nginx

Say you want to host simple static file hosted in /var/www/html/ using nginx container:

# docker run --name my-nginx-ii -p 80:80 -v /var/www/html/:/usr/share/nginx/html:ro -d nginx

Where,

–name my-nginx-i : Assign a name to the container
–detach : Run container in background and print container ID
-v /var/www/html/:/usr/share/nginx/html:ro : Bind mount a volume
-p 80:80 : Publish a container’s port(s) to the host i.e redirect all traffic coming to port 80 to container traffic

Go ahead and create a file named index.html in /var/www/html/:

# echo 'Welcome. I am Nginx server locked inside Docker' > /var/www/html/index.html

Test it:

curl http://your-host-ip-address/
curl 192.168.1.7

Sample outputs:

Welcome. I am Nginx server locked inside Docker

How to run a command in a running container

Run ls /etc/nginx command for my-nginx-i container

# docker exec e535e4c08c07 ls /etc/nginx

OR

# docker exec my-nginx-i ls /etc/nginx

Want to gain bash shell for a running container and make changes to nginx image?

# docker exec -i -t e535e4c08c07 bash

OR

# docker exec -i -t my-nginx-i bash


How To Use netstat


Introduction

netstat (network statistics) is a command line tool for monitoring network connections both incoming and outgoing as well as viewing routing tables, interface statistics etc. netstat is available on all Unix-like Operating Systems and also available on Windows OS as well. It is very useful in terms of network troubleshooting and performance measurement. netstat is one of the most basic network service debugging tools, telling you what ports are open and whether any programs are listening on ports.


Listing all the LISTENING Ports of TCP and UDP connections

$ netstat -a | more


Listing TCP Ports connections

Listing only TCP (Transmission Control Protocol) port connections:

$ netstat -at


Listing UDP Ports connections

Listing only UDPUser Datagram Protocol ) port connections:

$ netstat -au


Listing All LISTENING Connections

Listing all active listening ports connections:

$ netstat -l

Listing All TCP Listening Ports

Listing all active listening TCP ports:

$ netstat -lt


Listing All UDP Listening Ports

Listing all active listening UDP ports:

$ netstat -lu


Listing all UNIX Listening Ports

Listing all active UNIX listening ports:

$ netstat -lx


Showing Statistics by Protocol

Displays statistics by protocol. By default, statistics are shown for the TCP, UDP, ICMP, and IP protocols. The -s parameter can be used to specify a set of protocols:

$ netstat -s


Showing Statistics by TCP Protocol

Showing statistics of only TCP protocol:

$ netstat -st


Showing Statistics by UDP Protocol

Showing statistics of only UDP protocol:

$ netstat -su


Displaying Service name with PID

Displaying service name with their “PID/Program Name”:

$ netstat -tp


Displaying Promiscuous Mode

Displaying Promiscuous mode with -ac switch, netstat print the selected information or refresh screen every five second. Default screen refresh in every second.

$ netstat -ac 5 | grep tcp


Displaying Kernel IP routing

Display Kernel IP routing table with netstat and route command:

$ netstat -r


Showing Network Interface Transactions

Showing network interface packet transactions including both transferring and receiving packets with MTU size:

$ netstat -i


Showing Kernel Interface Table

Showing Kernel interface table, similar to ifconfig command:

$ netstat -ie


Displaying IPv4 and IPv6 Information

Displays multicast group membership information for both IPv4 and IPv6:

$ netstat -g


Print netstat Information Continuously

To get netstat information every few second, then use the following command, it will print netstat information continuously, say every few seconds

$ netstat -c


Finding Non Supportive Address

Finding un-configured address families with some useful information:

$ netstat --verbose


Finding Listening Programs

Find out how many listening programs running on a port:

$ sudo netstat -ap | grep ssh


Displaying RAW Network Statistics

$ netstat --statistics --raw

How To Use smartctl


Introduction

The step by step command example below show the process of using SMART disk monitoring tool that provide us with the information of overall hard disk health status. The SMART it self stand for Self Monitoring Analysis and Reporting Tool and on Linux, the smartctl command is use to display and manipulate SMART. The step by step example below show how to use smartctl command to enable SMART and disable SMART on the hard disk drives and the example below also show the use the smartctl command to get hard disk drive health status.


Installation

On Ubuntu use apt:

$ sudo apt install smartmontools

On CentOS, use yum:

$ sudo  yum install smartmontools


Enabling SMART Monitoring Tools on Hard Disk Devices (turn on SMART)

To enable SMART on hard disk drive, the example below show that the SMART is enable (turn to ON status) on the /dev/sdc :

$ sudo smartctl -s on /dev/sdc

Verify the SMART status turn to Enable (on) for the disk device:

$ sudo smartctl -i /dev/sdc

Test if your disk has SMART support:

$ sudo smartctl -i -d ata /dev/sdc

Note: The command example below show another example of smartctl command that can be use to enable SMART monitoring tool on the disk device:

$ sudo smartctl --smart=on --offlineauto=on --saveauto=on /dev/sdc


Disable SMART Monitoring Tools on Hard Disk Devices (turn off SMART)

To disable the SMART monitoring tool for the disk device:

$ sudo smartctl -s off /dev/sdc

To verify the changes made:

$ sudo smartctl -i /dev/sdc


Get Hard Disk Device SMART Health Status

The smart command example below show the information on the hard disk device health status for /dev/sdc device. {if you get FAILED, you should start backing up your data and browsing adds for a new hard drive. }

$ sudo  smartctl -H /dev/sdc


To run short test on your hard disk

$ sudo smartctl -t short /dev/sdc


To see the selftest logs of smartctl

$ sudo smartctl -l selftest /dev/sdc


To check past problems of your drive

$ sudo smartctl -l error /dev/sdc

$ sudo smartctl -d ata --all /dev/sdc

$ sudo smartctl -a /dev/sdc | grep -i reallocated

The 323 > 0 means that everything is NOT OK, then you should think about the replacement.

$ sudo smartctl -q errorsonly -H -l selftest -l error /dev/sdc


Nagios Alerts Via Pushover


I came across Pushover recently which makes it easy to send real-time notifications to your Android and iOS devices. And easy it is. It also allows you to set up applications with logos so that you can have multiple Nagios installations shunting alerts to you via Pushover with each one easily identifiable. After just a day playing with this, it’s much nicer than SMS’.

So, to set up Pushover with Nagios, first register for a free Pushover account. Then create a new application for your Nagios instance. I set the type to Script and also upload a logo. After this, you will be armed with two crucial pieces of information: your application API tokan/key ($APP_KEY) and your user key ($USER_KEY).

To get the notification script, clone this GitHub repository or just down this file – notify-by-pushover.php.

You can test this immediately with:

$ echo "Test message" | ./notify-by-pushover.php HOST $APP_KEY $USER_KEY RECOVERY OK

The parameters are:

USAGE: notify-by-pushover.php  $APP_KEY $USER_KEY NOTIFICATIONTYPE

Now, set up the new notifications in Nagios commands.cfg:

# 'notify-by-pushover-service' command definition
define command{
   command_name notify-by-pushover-service
   command_line /usr/bin/printf "%b" "$NOTIFICATIONTYPE$: \
       $SERVICEDESC$@$HOSTNAME$: $SERVICESTATE$ ($SERVICEOUTPUT$)" |                            \
     /usr/local/nagios/plugins/notify-by-pushover.php \
       SERVICE $APP_KEY $CONTACTADDRESS1$           \
       $NOTIFICATIONTYPE$ $SERVICESTATE$
}

# 'notify-by-pushover-host' command definition
define command{
 command_name notify-by-pushover-host
 command_line /usr/bin/printf "%b" "Host '$HOSTALIAS$'    \
       is $HOSTSTATE$: $HOSTOUTPUT$" |                    \
     /usr/local/nagios-plugins/notify-by-pushover.php \
       HOST $APP_KEY $CONTACTADDRESS1$ $NOTIFICATIONTYPE$ \
       $HOSTSTATE$
}

Then, in your contact definition(s) add/update as follows:

define contact{
 contact_name ...
 ...
 service_notification_commands ...,notify-by-pushover-service
 host_notification_commands ...,notify-by-pushover-host
 address1 $USER_KEY
}

Make sure you break something to test that this works!

Logging With Journald In CentOS7


Introduction

CentOS 7 comes with services which saves logging information. Some services write their own logs directly to their log information files, e.g. apache maintain their own logs. Some of the service maintain their logs through systemctl. Systemctl is a services that take care of starting, stopping or monitoring the status of a process. systemctl further communicates to journald which keep track on log information. journalctl is used to grep log information from journald.

rsyslog is the classical logging method. You may ask either we should use journalctl or rsyslog to maintain our logging information. We can integrate both rsyslog ans journald. The rsyslog messages will be sent to journald or vice versa. The facility is not enabled by default.


Definition of Journal

Journal is a component of systemd. It capture log messages of kernel logs, syslog messages, or error log messages. It collect them, index them and makes available to the users. Journal are stored in /run/log/journal directory.


Lets have a look on current log database:

When used alone, every journal entry that is in the system will be displayed within a pager (usually less) for you to browse. The oldest entries will be up top:

$ sudo journalctl

You will likely have pages and pages of data to scroll through, which can be tens or hundreds of thousands of lines long if systemd has been on your system for a long while. But, there are some remarkable difference, in journalctl lines having notices or waning will be bold, time-stamps are your local time zone, after every boot a new line will be added to clarify that new log begins from now, errors will be highlighted red.


See log message of current boot only

$ sudo journalctl -b


Let us see some error messages

$ sudo journalctl -p err

To have last 10 events that happen, type

$ sudo journalctl -f


See how must disk space is occupied by journal

$ sudo journalctl --disk-usage
Archived and active journals take up 16.0M in the file system.


To get data of previous day

$ sudo journalctl --since yesterday

To get current system time zone

$ timedatectl  
     Local time: Fri 2017-06-16 17:06:35 +04
 Universal time: Fri 2017-06-16 13:06:35 UTC
       RTC time: Fri 2017-06-16 13:06:35
      Time zone: Asia/Dubai (+04, +0400)
Network time on: yes
NTP synchronized: yes
RTC in local TZ: no


List system time zone

$ timedatectl list-timezones


Set system time zone

$ sudo timedatectl set-timezone Asia/Dubai


Integration of Journald with Rsyslog

With the integration the rsyslog messages will be sent to journald or vice versa. The facility is not enabled by default.  To enable sending log messages to journal  rsyslog.conf is required to configure.

Edit /etc/rsyslog.conf

search for $ModLoad imuxsock and and $ModLoad imjournal

add $OmitLocalLoggin off in a new line

[root@localhost ~]# vim /etc/rsyslog.conf

Sample output

#rsyslog configuration file
# For more information see /usr/share/doc/rsyslog-*/rsyslog_conf.html
# If you experience problems, see http://www.rsyslog.com/doc/troubleshoot.html
#### MODULES ####
# The imjournal module bellow is now used as a message source instead of imuxsock.
$ModLoad imuxsock # provides support for local system logging (e.g. via logger command)
$OmitLocalLoggin off
$ModLoad imjournal # provides access to the systemd journal
#$ModLoad imklog # reads kernel messages (the same are read from journald)
#$ModLoad immark # provides –MARK– message capability
# Provides UDP syslog reception
#$ModLoad imudp
#$UDPServerRun 514
# Provides TCP syslog reception
#$ModLoad imtcp
#$InputTCPServerRun 514
#### GLOBAL DIRECTIVES ####

Save the file and exit.

Open /etc/rsyslog.d/listen.conf

[root@localhost ~]# vim /etc/rsyslog.d/listen.conf

Make sure following line is already present in the file, if not so then add this line to the file.

$SystemLogSocketName /run/systemd/journal/syslog

Save and exit.

Now, This will make connection b/w rsyslog and journald.

Logical Volume Manager (LVM)


Introduction

With LVM, we can create logical partitions that can span across one or more physical hard drives. First, the hard drives are divided into physical volumes, then those physical volumes are combined together to create the volume group and finally the logical volumes are created from volume group.Before we start, install the lvm2 package.

On CentOS use yum:

$ sudo yum install lvm2

On Ubuntu use apt:

$ sudo apt install lvm2

To create a LVM, we need to run through the following steps:

  1. Select the physical storage devices for LVM
  2. Create the Volume Group from Physical Volume
  3. Create Logical Volumes from Volume Group

Creating LVM Volumes

To begin, use the fdisk command to create physical partitions for the storage device on which you want to create logical partitions. Here we have an 500GB drive, located on device /dev/sdc:


Before proceeding, make sure you have made the correct changes to the correct partition! If everything looks correct, write the new partition table, as follows:

The kernel still uses the old table. The new table will be used at the next reboot or after you run partprobe(8) or kpartx(8).

Back at the shell prompt, use the sfdisk command to see the partitioning on the drive:


or

Next, make /dev/sdc1 a new LVM physical volume and use the pvs command to view information about physical LVM volumes:

Then use vgcreate to create the vg1 volume group and list the active current volume groups:

Use lvcreate to create a new LVM partition of 1 GB from the vg1 volume group. Then use lvs to see the logical volume and vgs to see that the amount of free space has changed:

To create an ext4 filesystem on the lvm partition, use the mkfs.ext4 command as follows:

The ext4 filesystem has now been created and the LVM volume is ready to use.


Using LVM Volumes

To use the new volume just created, represented by /dev/mapper/vg1-lvm_u1, create a mount point /mnt/u1  and mount the volume. Then use df to check the available space:

At this point, the file system contains only the lost+found directory:

Copy a file to the new file system. For example, choose one of the kernel files from the /boot directory and copy it to /mnt/u1:

Run md5sum on the file you copied and save the resulting checksum for later:


Growing the LVM Volume

Say that you are running out of space and you want to add more space to your LVM volume. To do that, unmount the volume and use the lvresize command. ( Actually, it is not required that you unmount the volume to grow it, but it is done here as an extra precaution. )  After that, you must also check the file system with e2fsck and run resize2fs to resize the ext4 filesystem on that volume:

In the example just shown, the volume and the file system are both resized to 3 GB. Next, mount the volume again and check the disk space and the md5sum you created earlier:

The newly mounted volume is now 3 GB instead of 1 GB in size.


Shrinking an LVM Volume

You can also use the lvresize command if you want to take unneeded space from an existing LVM volume. As before, unmount the volume before resizing it and run e2fsck (to check the file system) and resize2fs (to resize it to the smaller size):

The newly mounted volume appears now as 1984 MB instead of 2992 MB in size.


Removing LVM Logical Volumes and Groups

To remove an LVM logical volume from a volume group, unmount it and then use the lvremove command as follows:

To remove an existing LVM volume group, use the vgremove command: